
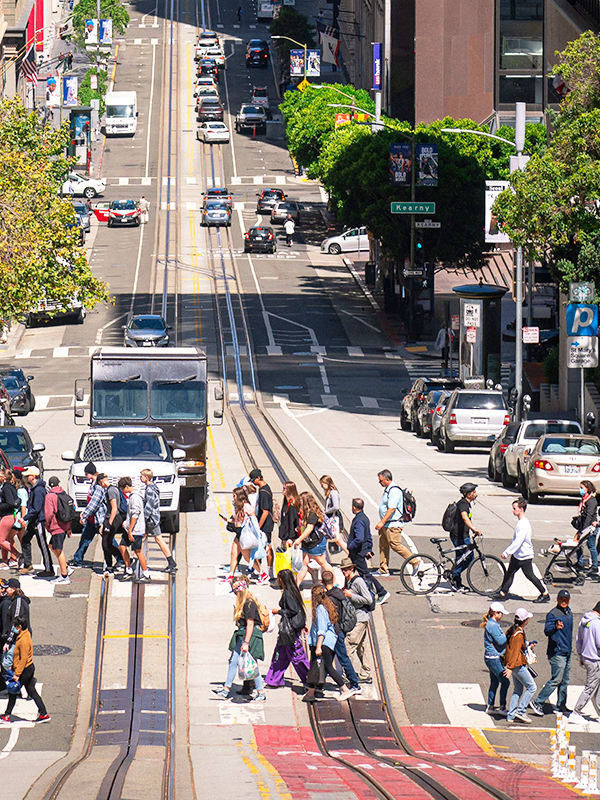
VMT reduction has become a central objective of California transportation and land use policy. It shows up in SB 743 compliance, climate action plans, housing elements, and Vision Zero strategies. But practitioners working on these efforts often face the same challenge: how do you translate a built environment decision into an evidence-based, quantifiable expectation for how much driving it will generate or reduce? Without that, it’s hard to evaluate tradeoffs, compare scenarios, or make the case to decision-makers.
That’s a gap our team set out to close.
We developed a statistical model as part of a new study built around a deliberate design choice: including only variables that planners and policymakers can actually control. Not income. Not household size. Not demographics. The variables that made the cut are the ones that respond to planning decisions: population density, employment density, intersection density, transit frequency, job accessibility by transit, and housing affordability.
The results are consistent across every major metropolitan region in the state: the Bay Area, Southern California, Sacramento, San Diego, and smaller MPO areas alike. Compact, mixed-use development paired with frequent, competitive transit service shows the strongest association with lower driving. But that’s not the only takeaway for practitioners. Not every community has strong transit to build on, and the research shows that’s not the whole story. Incrementally increasing density, adding a mix of uses, and improving walkability and street connectivity each move VMT in the right direction, even without major transit investment. These shifts don’t have to happen all at once to make a difference. Communities can start where they have the most control and build from there.
This research is part of a broader body of work connecting built environment decisions to outcomes across safety, climate, public health, and economic vitality. Last month, our colleagues published peer-reviewed findings linking VMT and mode share directly to traffic fatality rates. The variables that predict how much people drive also predict how safe communities are. The factors are the same. The opportunity to move multiple outcomes at once is real.
Related: Demand Management Is Injury Prevention · Safety Multipliers · MXD: Mixed-Use Trip Generation · Q&A: VMT Under CEQA · VMT Impacts · SB 743
If you’re working on a general plan update, an SB 743 analysis, a housing element, or a VMT reduction strategy and want to explore how this model applies to your context, we’d love to think through what this means for your community.
share this article
Connect with our Contributors

Jennifer Ziebarth
Associate
PhD
Email Me

Matt Goyne
Principal
PE
Email Me

Mackenzie Watten
Travel Behavior Practice Leader
PTP
Email Me

Rey Hosseinzade
PhD
Email Me
Explore More
Implementing SB 743 Berkeley Law
This report by Berkeley Law explores how California communities can use Vehicle Miles Traveled (VMT) banking and exchange programs to meet environmental goals under SB 743.
WRCOG SB 743 Implementation Pathway
This document provides guidance for implementing California’s SB 743 in the Western Riverside County area, focusing on using Vehicle Miles Traveled (VMT) as a key metric in transportation impact analysis.

Transportation Impact Analysis: Replacing LOS with VMT
This article discusses California’s shift from using Level of Service (LOS) to Vehicle Miles Traveled (VMT) for evaluating transportation impacts under the California Environmental Quality Act (CEQA), highlighting the implications of Senate Bill 743 (SB 743) for local agencies.