VMT: Going Beyond LOS
Why vehicle miles traveled (VMT) is becoming a preferred metric for transportation impact analysis
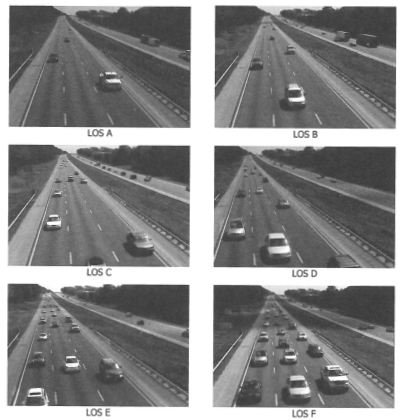
Exhibit 12-14 LOS Examples for Basic Freeway Segments
Source: 2016. Highway Capacity Manual 6th Edition: A Guide for Multimodal Mobility Analysis. Washington, DC: The National Academies Press. https://doi.org/10.17226/24798.
Examining Level of Service
LOS relies on letter grades, much like a report card, to describe the comfort and convenience of driving from a driver’s perspective. While getting a good LOS grade (e.g., LOS A-C) may be desirable to drivers, it represents inefficient use of public space, not to mention a variety of other adverse environmental effects, as documented in the research below.
Limitations of LOS as an Environmental Impact Metric
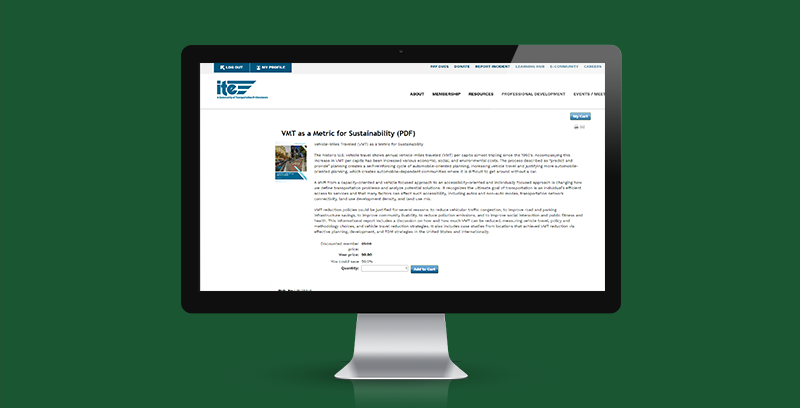
- Article, Institute of Transportation Engineers Journal: Biases inherent in the LOS metric (ITE Journal, Aug 2014, 5p): Decision, Values, and Data: Understanding Bias in Transportation Performance Measures
- Article, Institute of Transportation Engineers Journal: LOS-based transportation impact studies inhibit sustainable transportation (ITE Journal May 2014, 5p) Changing the Paradigm of Traffic Impact Studies: How Typical Traffic Studies Inhibit Sustainable Transportation
- Primer: The difference between accessibility and mobility (Susan Handy, Access Journal, 5p): Highway Blues: Nothing a Little Accessibility Can’t Cure
- Study: Pursuit of high LOS grades worsens transportation and lessens economic activity in Southern California (UCLA Lewis Center and UCLA Institute of Transportation Studies, 12p Executive Summary, 80p academic study): Congested Development: A Study of Traffic Delays, Access, and Economic Activity in Metropolitan
Los Angeles - Study: Pursuit of high LOS grades worsens transportation and lessens economic activity in Northern California (UCLA Lewis Center and UCLA Institute of Transportation Studies, 10p Executive Summary, 99p academic study) Not So Fast: A Study of Traffic Delays, Access, and Economic Activity in the San Francisco Bay Area
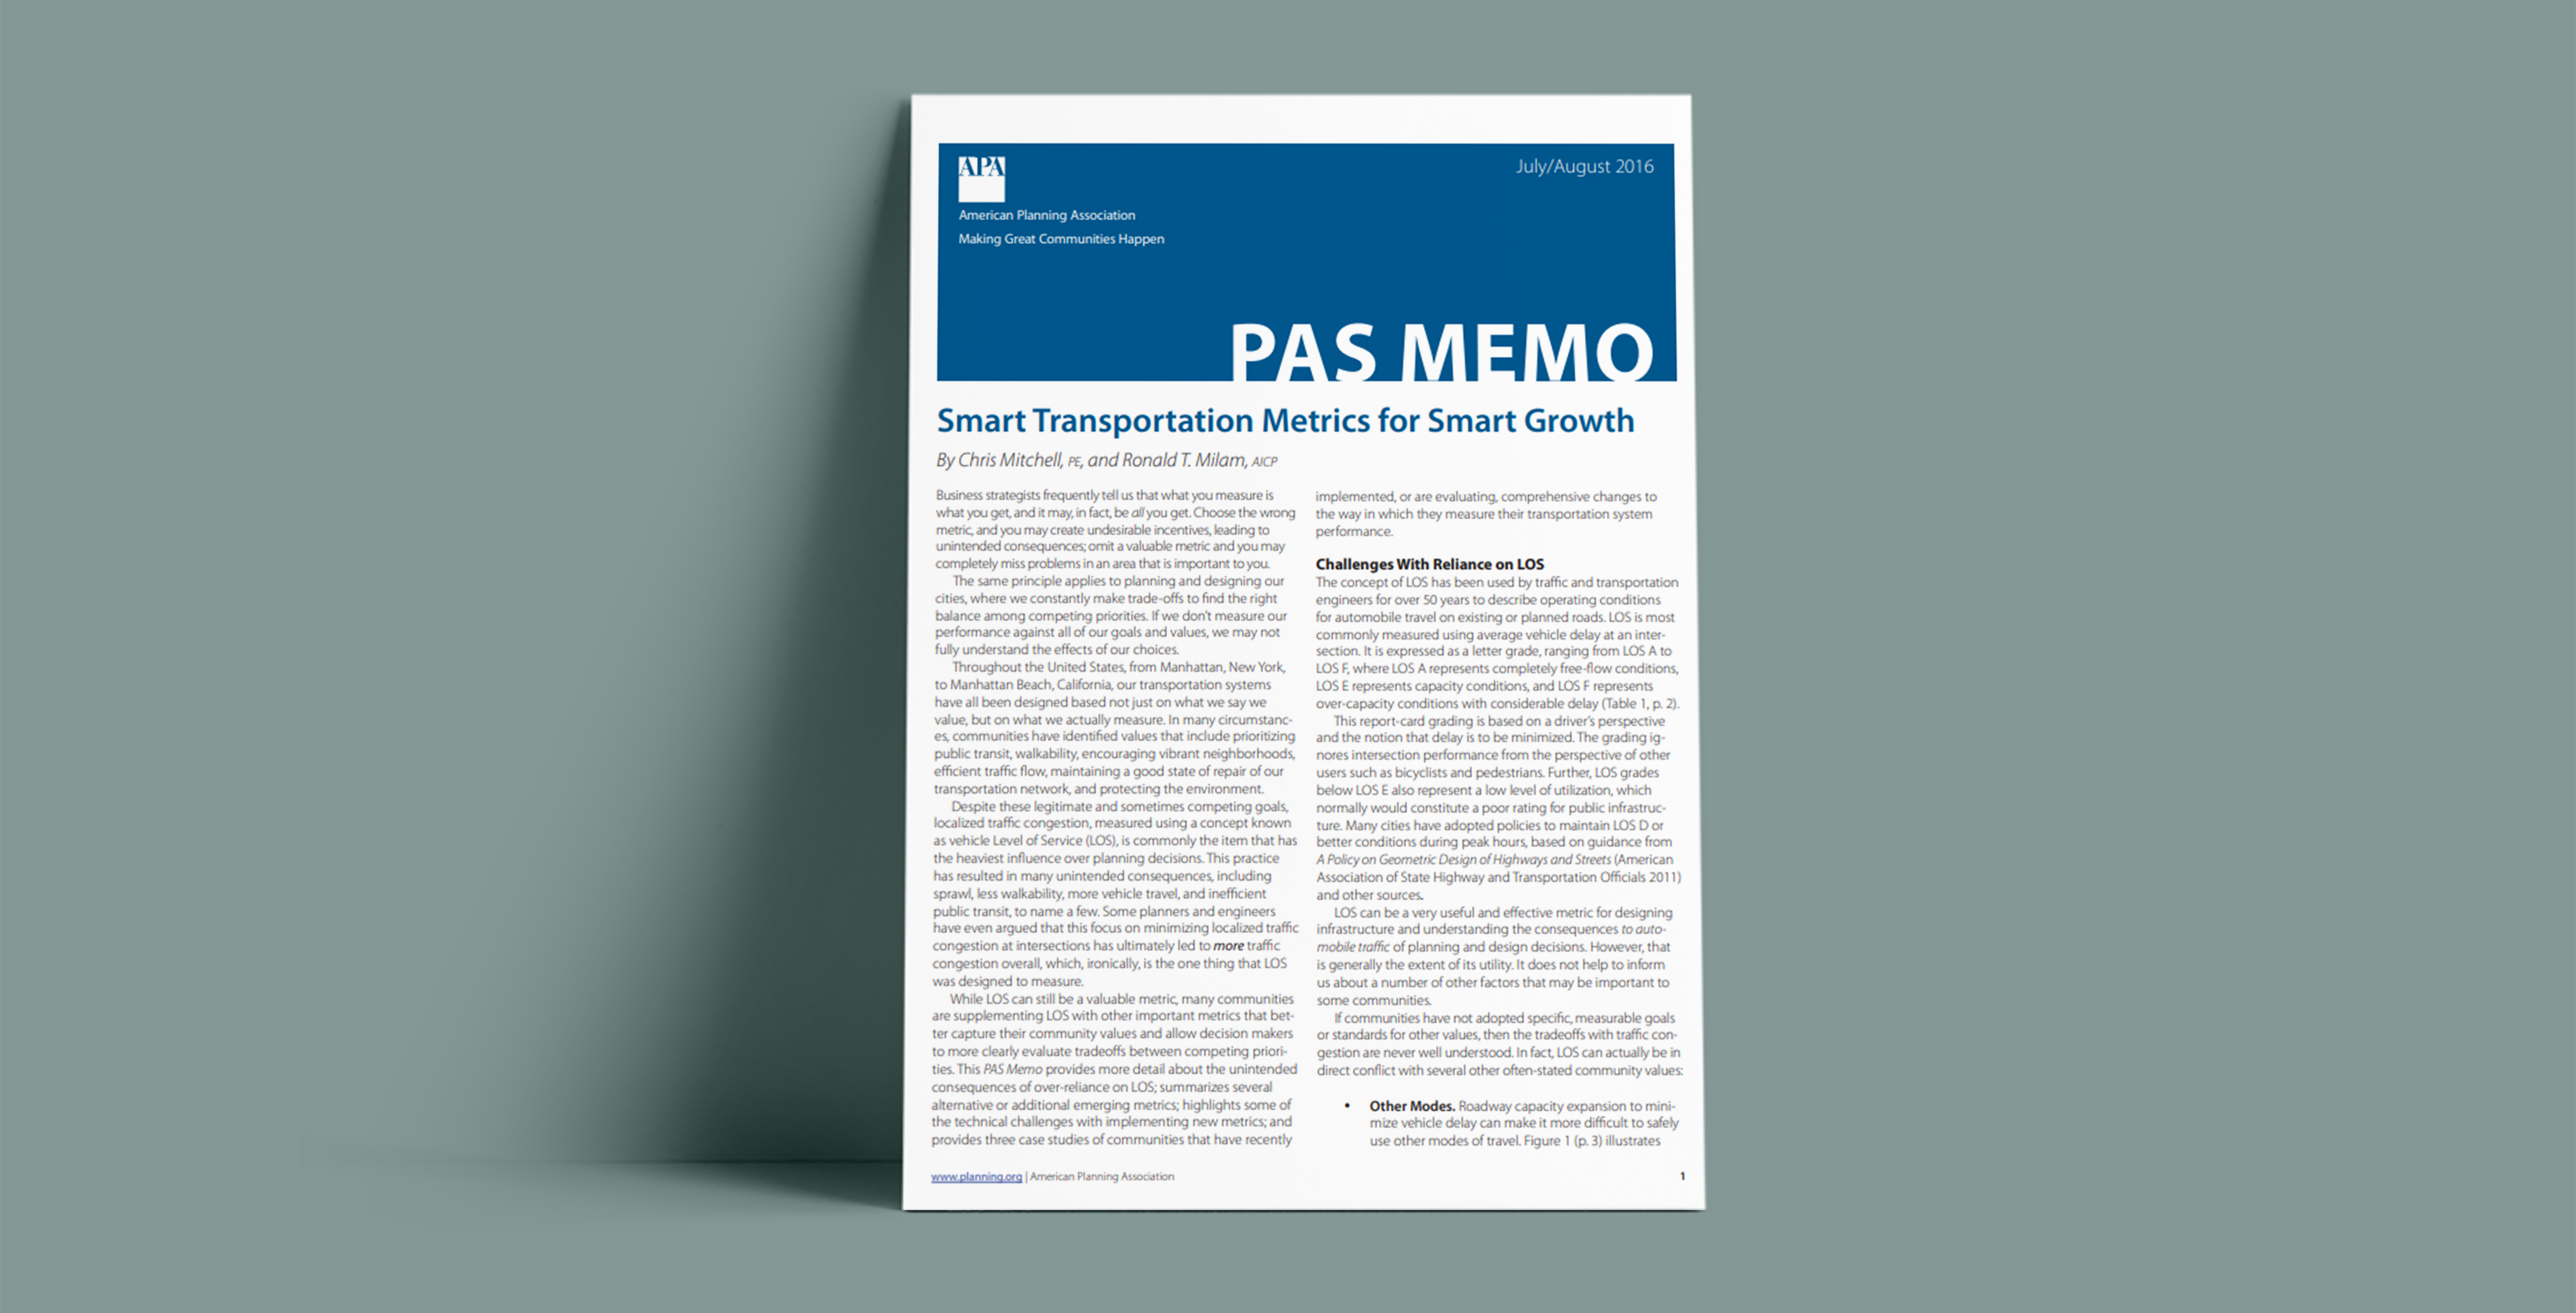
- Report: Problems with reliance on LOS, discussion of updated metrics (American Planning Association, 12p): Smart Transportation Metrics for Smart Growth
- Report: Problems with reliance on metrics of auto mobility and delay (Joe Cortright, Impresa and CEOs for Cities)
- Report: Potential to reduce petroleum reliance through updating LOS metric (Summary 1p, report 9p): Unraveling Petroleum: Use of Performance Measures that Prioritize Automobiles over Other Modes in Congested Areas
Source: California Governor’s Office of Planning and Research, Transportation Impacts (SB 743) https://opr.ca.gov/ceqa/updates/sb-743/
Expanding impact analysis metrics to include VMT can help provide a more complete perspective of the potential effects of land use and transportation decisions.
LOS Versus VMT: Measurement Matrix
The following measurements and considerations are used with each metric:
LOS
Emissions (Greenhouse Gases)
Emissions (Air Pollutants)
Fuel Consumption
Energy Consumption
Driver Delay (Speed)
Driver Delay (Intersection Wait Time)
Safety (Speed)
Safety (Collisions)
VMT
Emissions (Greenhouse Gases)
Emissions (Air Pollutants)
Fuel Consumption
Energy Consumption
Driver Delay (Speed)
Driver Delay (Intersection Wait Time)
Safety (Speed)
Safety (Collisions)
Exploring VMT
Rather than a letter grade, VMT measures the number of miles traveled by vehicles. The video below illustrates the components of VMT.
VMT Environmental Equivalencies
VMT provides direct equivalencies for other environmental effects, such as emissions and energy consumption. It is also an indicator for safety, because areas with low VMT generation rates have less frequent and less severe collisions.
The following measurements are equivalent to 1 additional VMT:
Pounds of Greenhouse Gas Emissions (GHG)
Gallons of Gasoline (Energy Consumption)
VMT as a Metric
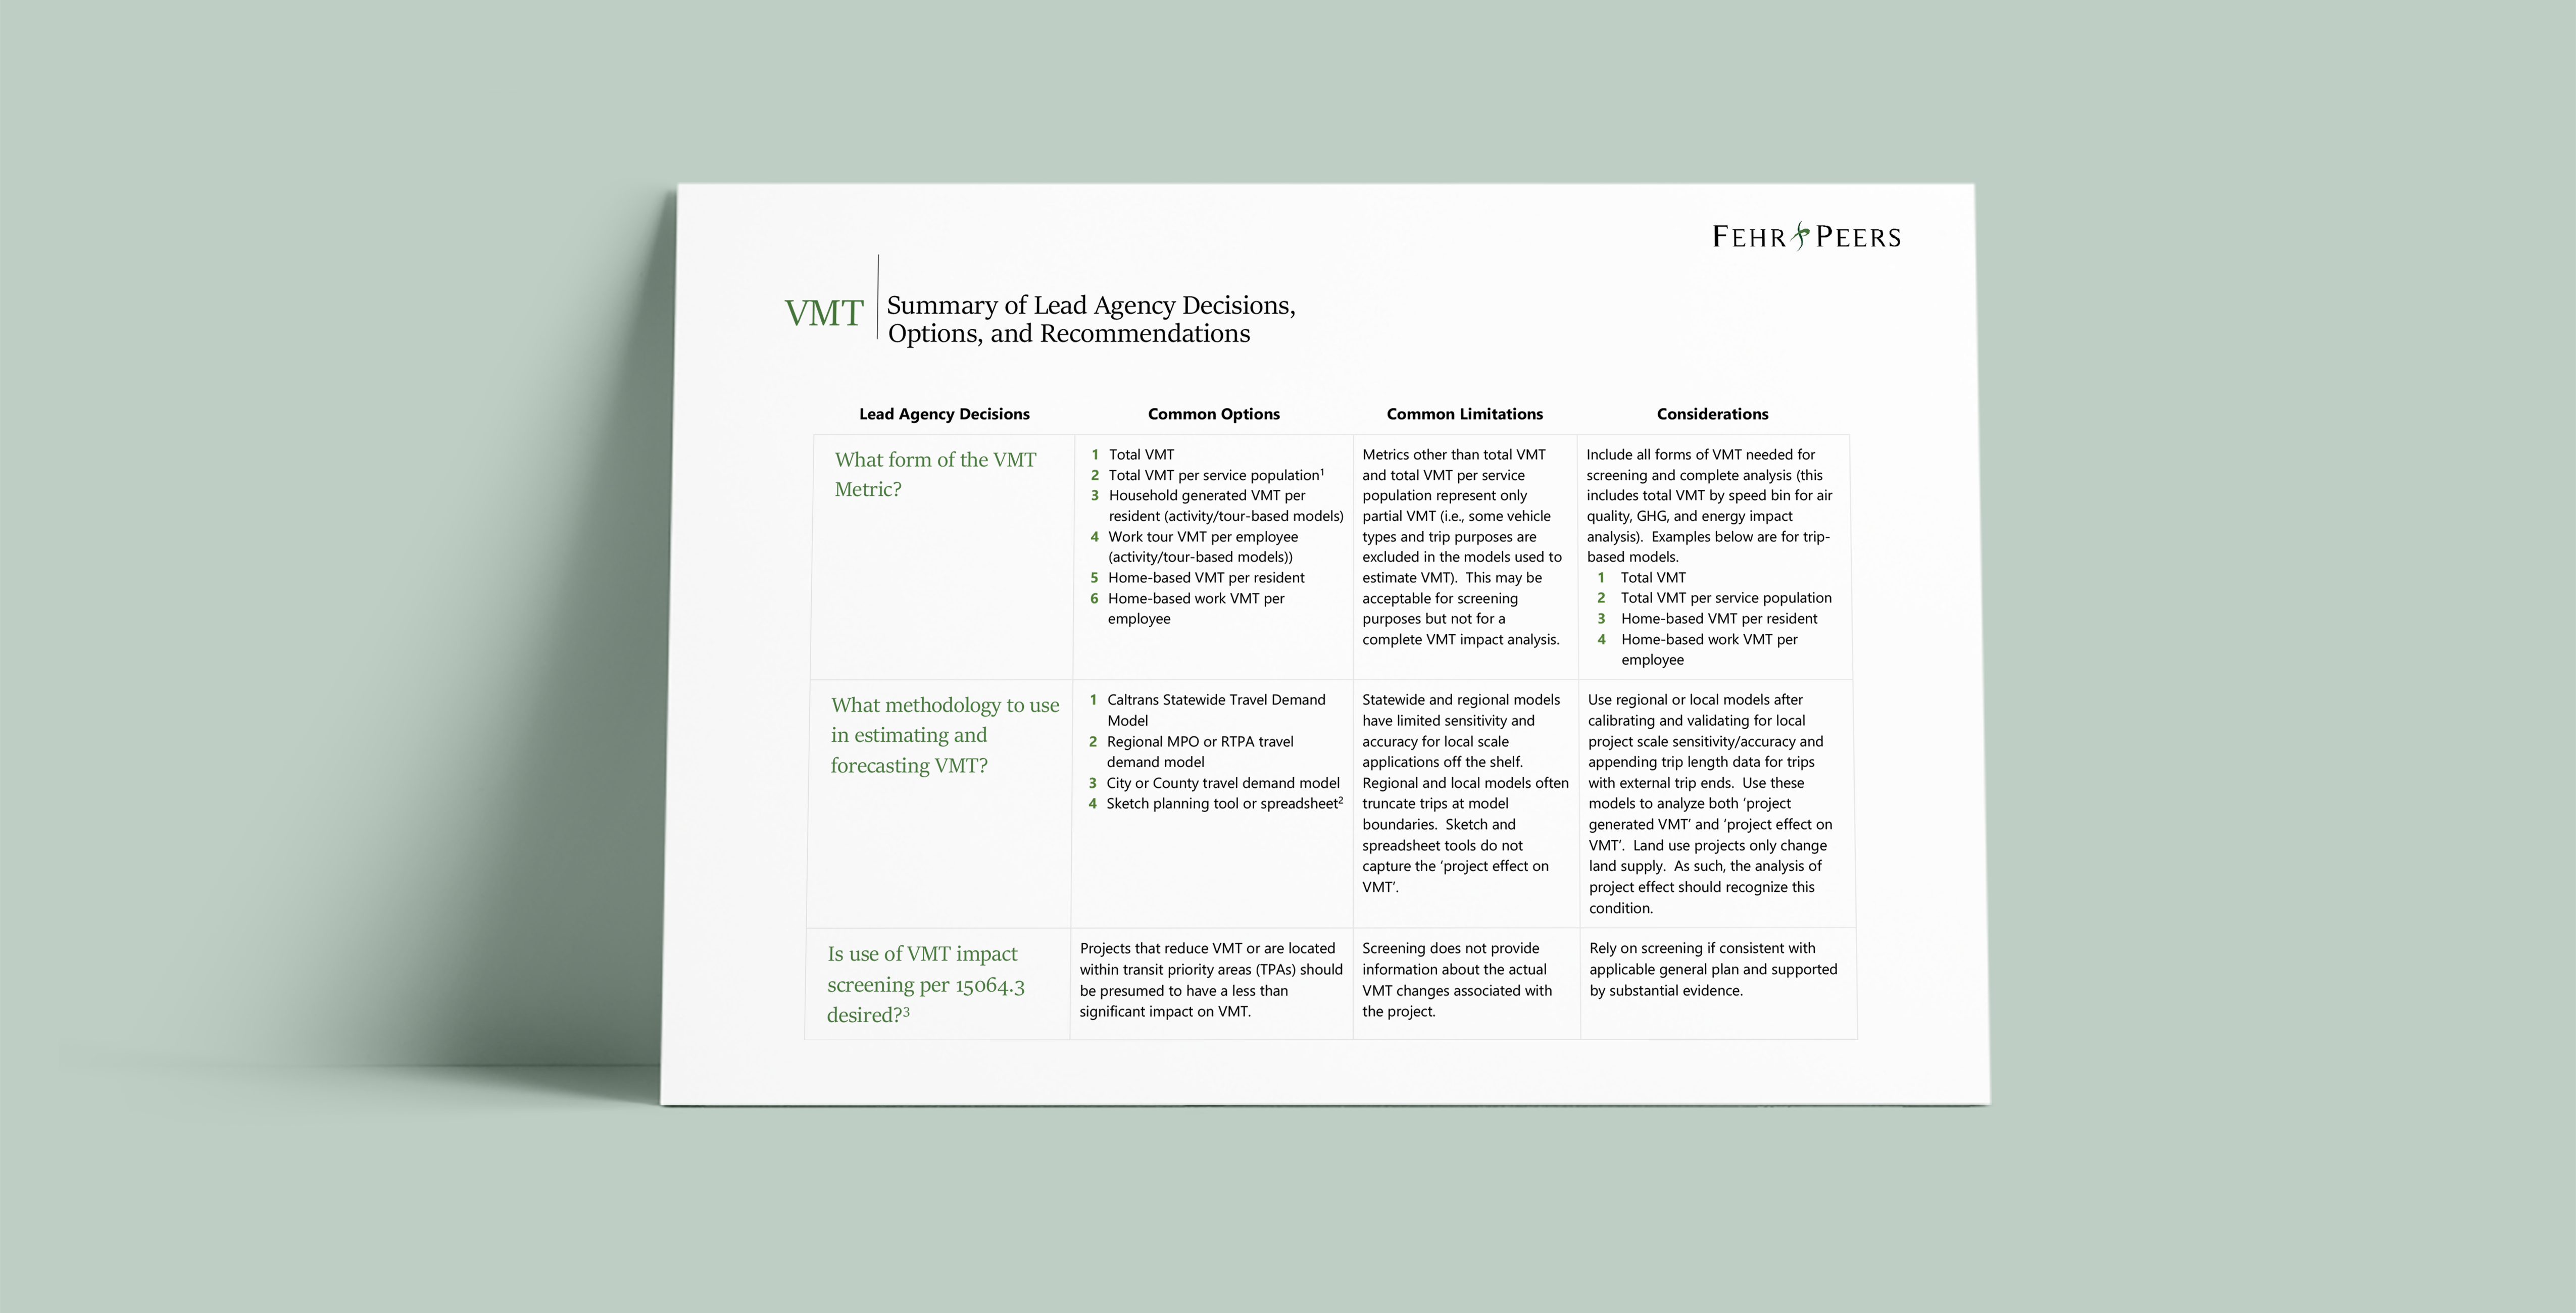
VMT metrics can take many forms, depending on the type of project or impact analysis. Some of the more common forms are explained in the lexicon below.
Total VMT
All vehicle trips (i.e., passenger and commercial vehicles) assigned on the network within a specific geographic boundary (i.e., model-wide, region-wide, citywide). Vehicle volume on each link is multiplied by link distance.
Total VMT Generated by a Project
All vehicle trips are traced to the zone or zones of study. This includes internal to internal (II), internal to external (IX), and external to internal (XI) trips. Final assignment origin-destination (OD) trip tables or production (P) and attraction (A) estimates multiplied by distance skims may be used. When the model has multiple assignment periods, OD trip tables and congested skims from each period should be used.
Total VMT per Employee
All automobile vehicle trips made by employed persons are traced back to the workplace of the trip-maker, even trips that aren’t part of the work tour (i.e., all trips from home to the work location and the return to home).
The allocation of responsibility within a jurisdiction is straightforward, since each trip is attached to a worker. However, if some workers have multiple work locations, then deciding which to count may be an issue.
Commercial vehicle trips are not included.
Home-Based VMT per Resident
All home-based automobile vehicle trips are traced back to the residence of the trip-maker; non-home-based trips are excluded.
This is similar to Total VMT per Service Population.
Total VMT per Service Population
This uses the same method as Total VMT Generated by a Project to estimate VMT and then divides by the population and employment of the zone or zones of study. If the model generates vehicle trips from other sources, such as students and visitors, then those variables are included in the service population. Note that employment is often used as the independent variable for total vehicle trip generation associated with non-residential land uses. This means that vehicle trips made by people other than the employees are accounted for in the trip rate, including visitors, customers, vendors, custodians, and delivery companies. For this reason, it is often difficult to draw conclusions about VMT patterns, and use of the metric should be limited to analysis scenarios comparing full model runs typically focused on changes at the sub-regional, city, county, or regional scale.
Some trip-based models may not use population and employment as trip generation variables.
Instead, they will rely on land uses. A “correspondence” between the model land use input variables and population and employment rates is required for these types of models.
Work Tour VMT per Employee
All automobile trips that are part of home-work tours or work-based tours are counted.
Allocation of responsibility within a jurisdiction is straightforward, since each tour or half-tour should be attached to a specific workplace.
Commercial vehicle trips are not included.
Residential VMT per Resident
All automobile (i.e., passenger cars and light-duty trucks) vehicle trips are traced back to the residence of the trip-maker, even non-home-based trips.
This is not applicable for trip-based models, since non-home-based (NHB) trips aren’t tied to the households making them.
It may be calculated either by averaging the daily VMT of all residents or by calculating total VMT, counting total residents, and dividing.
The allocation of responsibility within a jurisdiction (e.g., cities within a county) is straightforward, since each trip is attached to a resident and each resident has a single home location.
Household size determination is required, which can be subject to debate for different housing types (i.e., single-family, multi-family, and age-qualified housing products).
Commercial vehicle trips are not included.
Residential VMT per household is a related metric: the denominator is the total number of households instead of the total number of residents. The benefit of this metric form is that it doesn’t require an estimate of household size.
Total VMT per Land Use Unit
All vehicle trips are traced to the zone or zones of study. This includes internal to internal (II), internal to external (IX), and external to internal (XI) trips. Use trip estimates or trip tables multiplied by distance skims similar to the total VMT generated by a project.
Home-Based Work (HBW) VMT
All automobile trips between home and work are counted (a variant might also count work-based other trips).
Allocation of responsibility within a jurisdiction should be straightforward, except for work-based other trips from one work location to another; even in this case, it should be possible to decide which to count.
Commercial vehicle trips are not included.
VMT Analysis for Land Use vs Transportation Projects
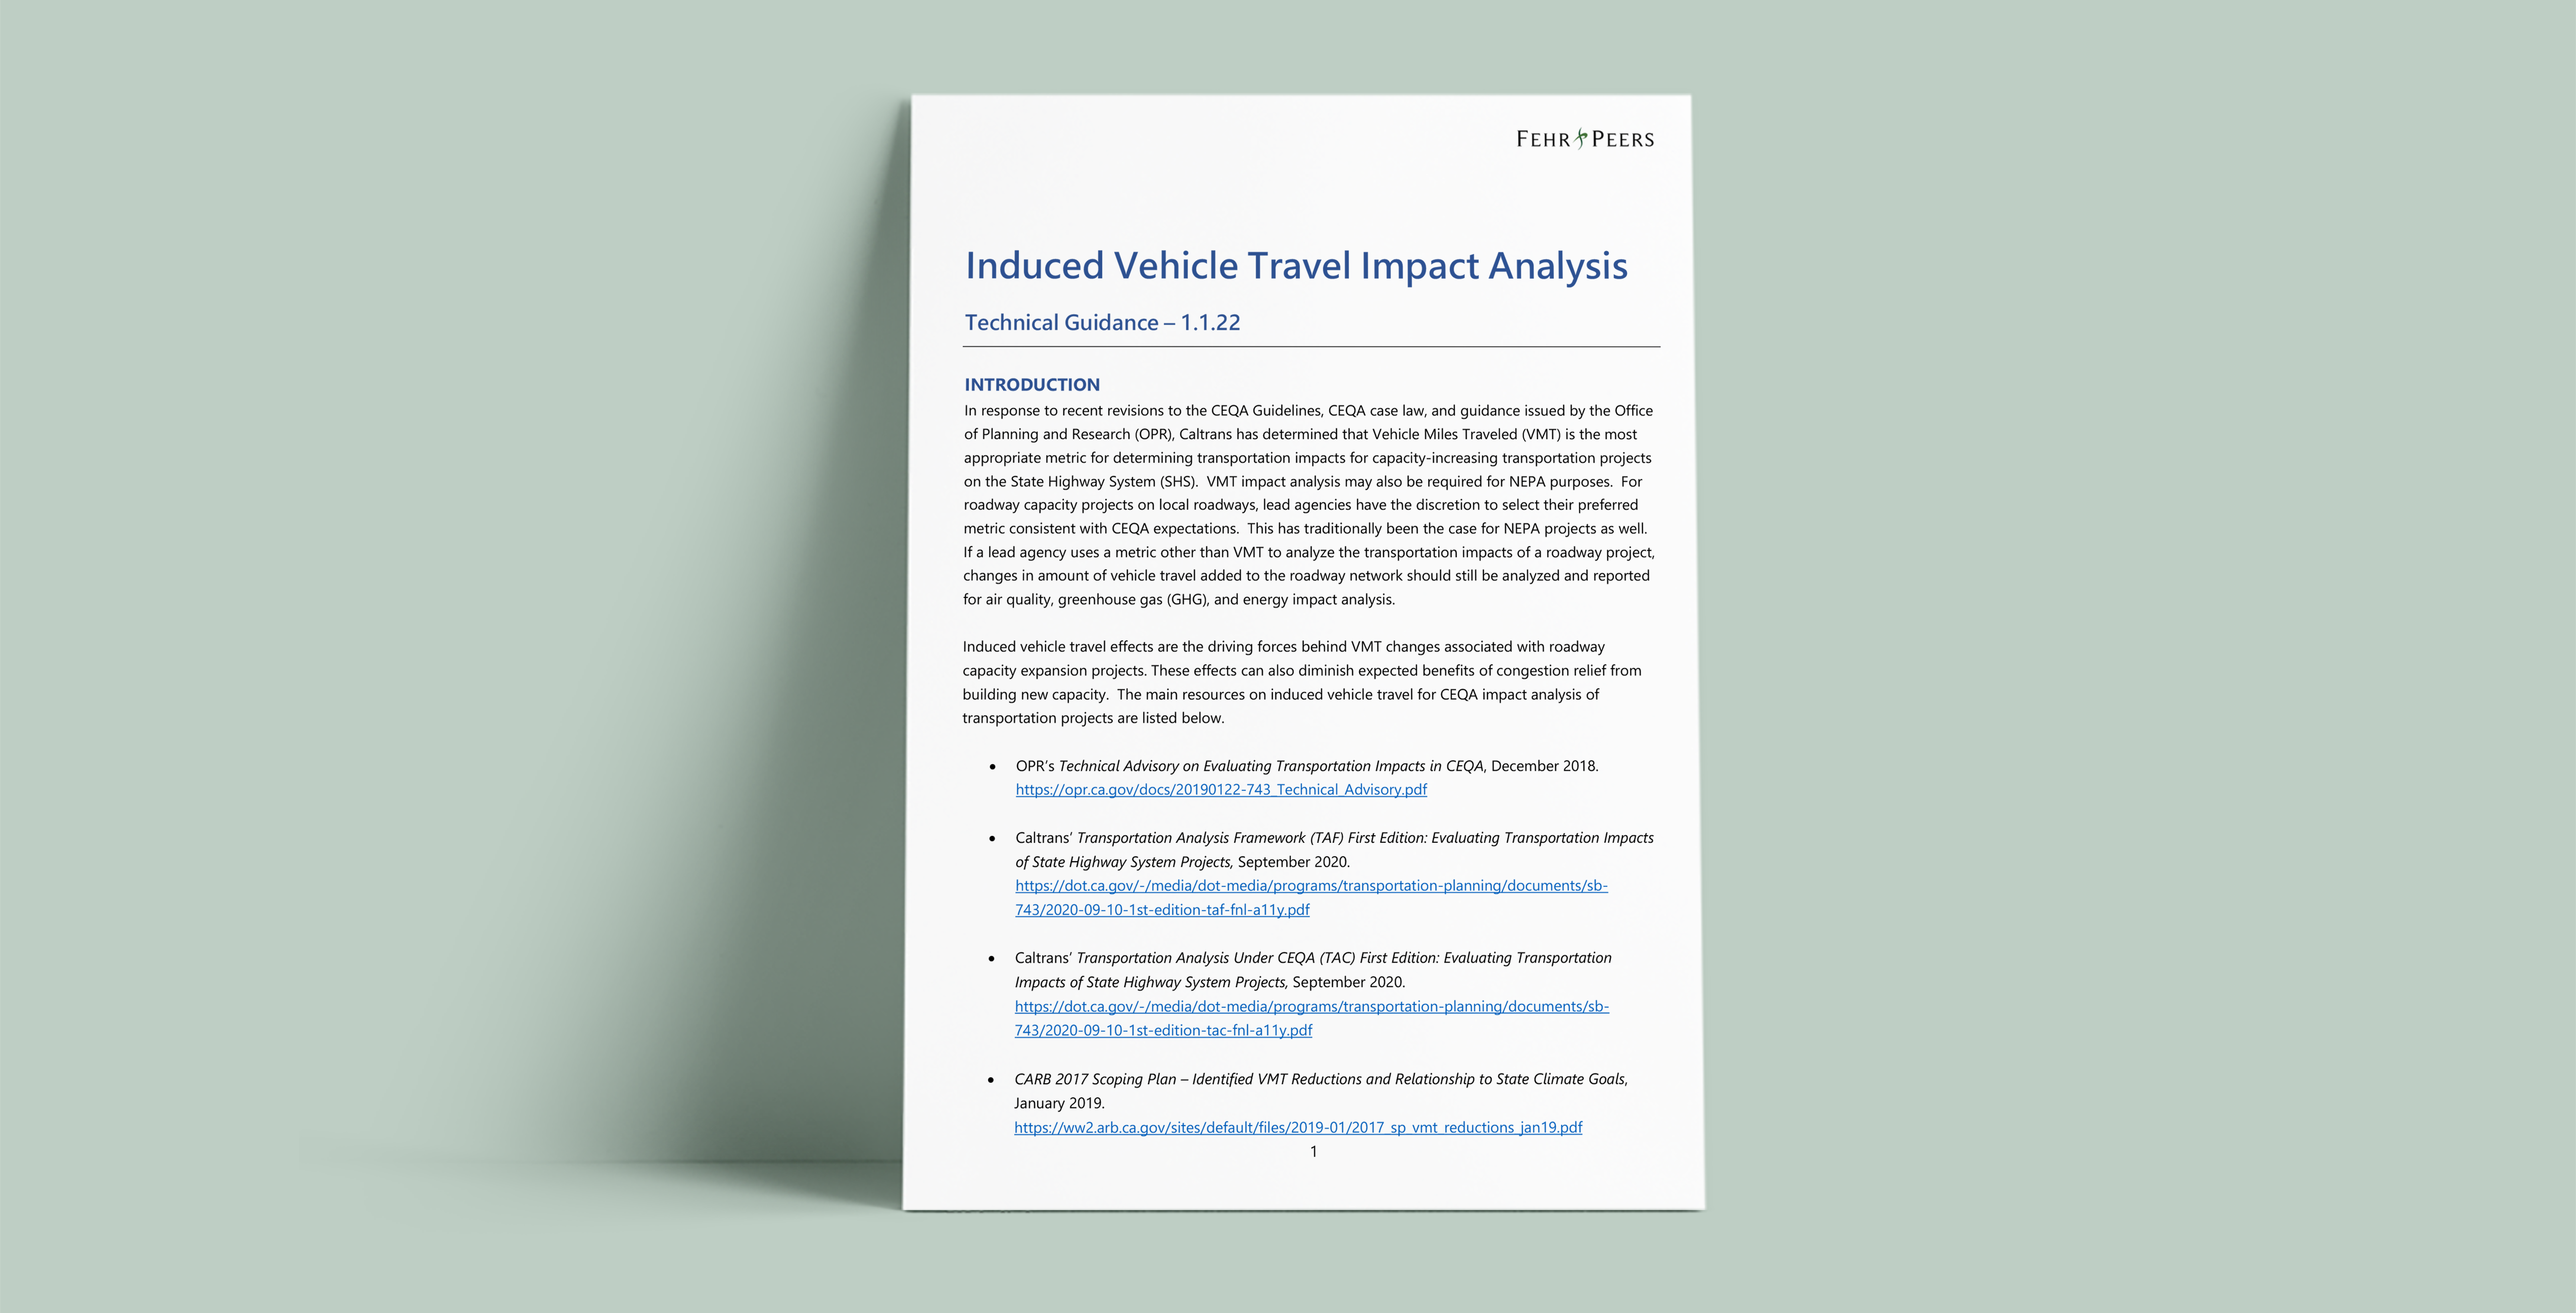
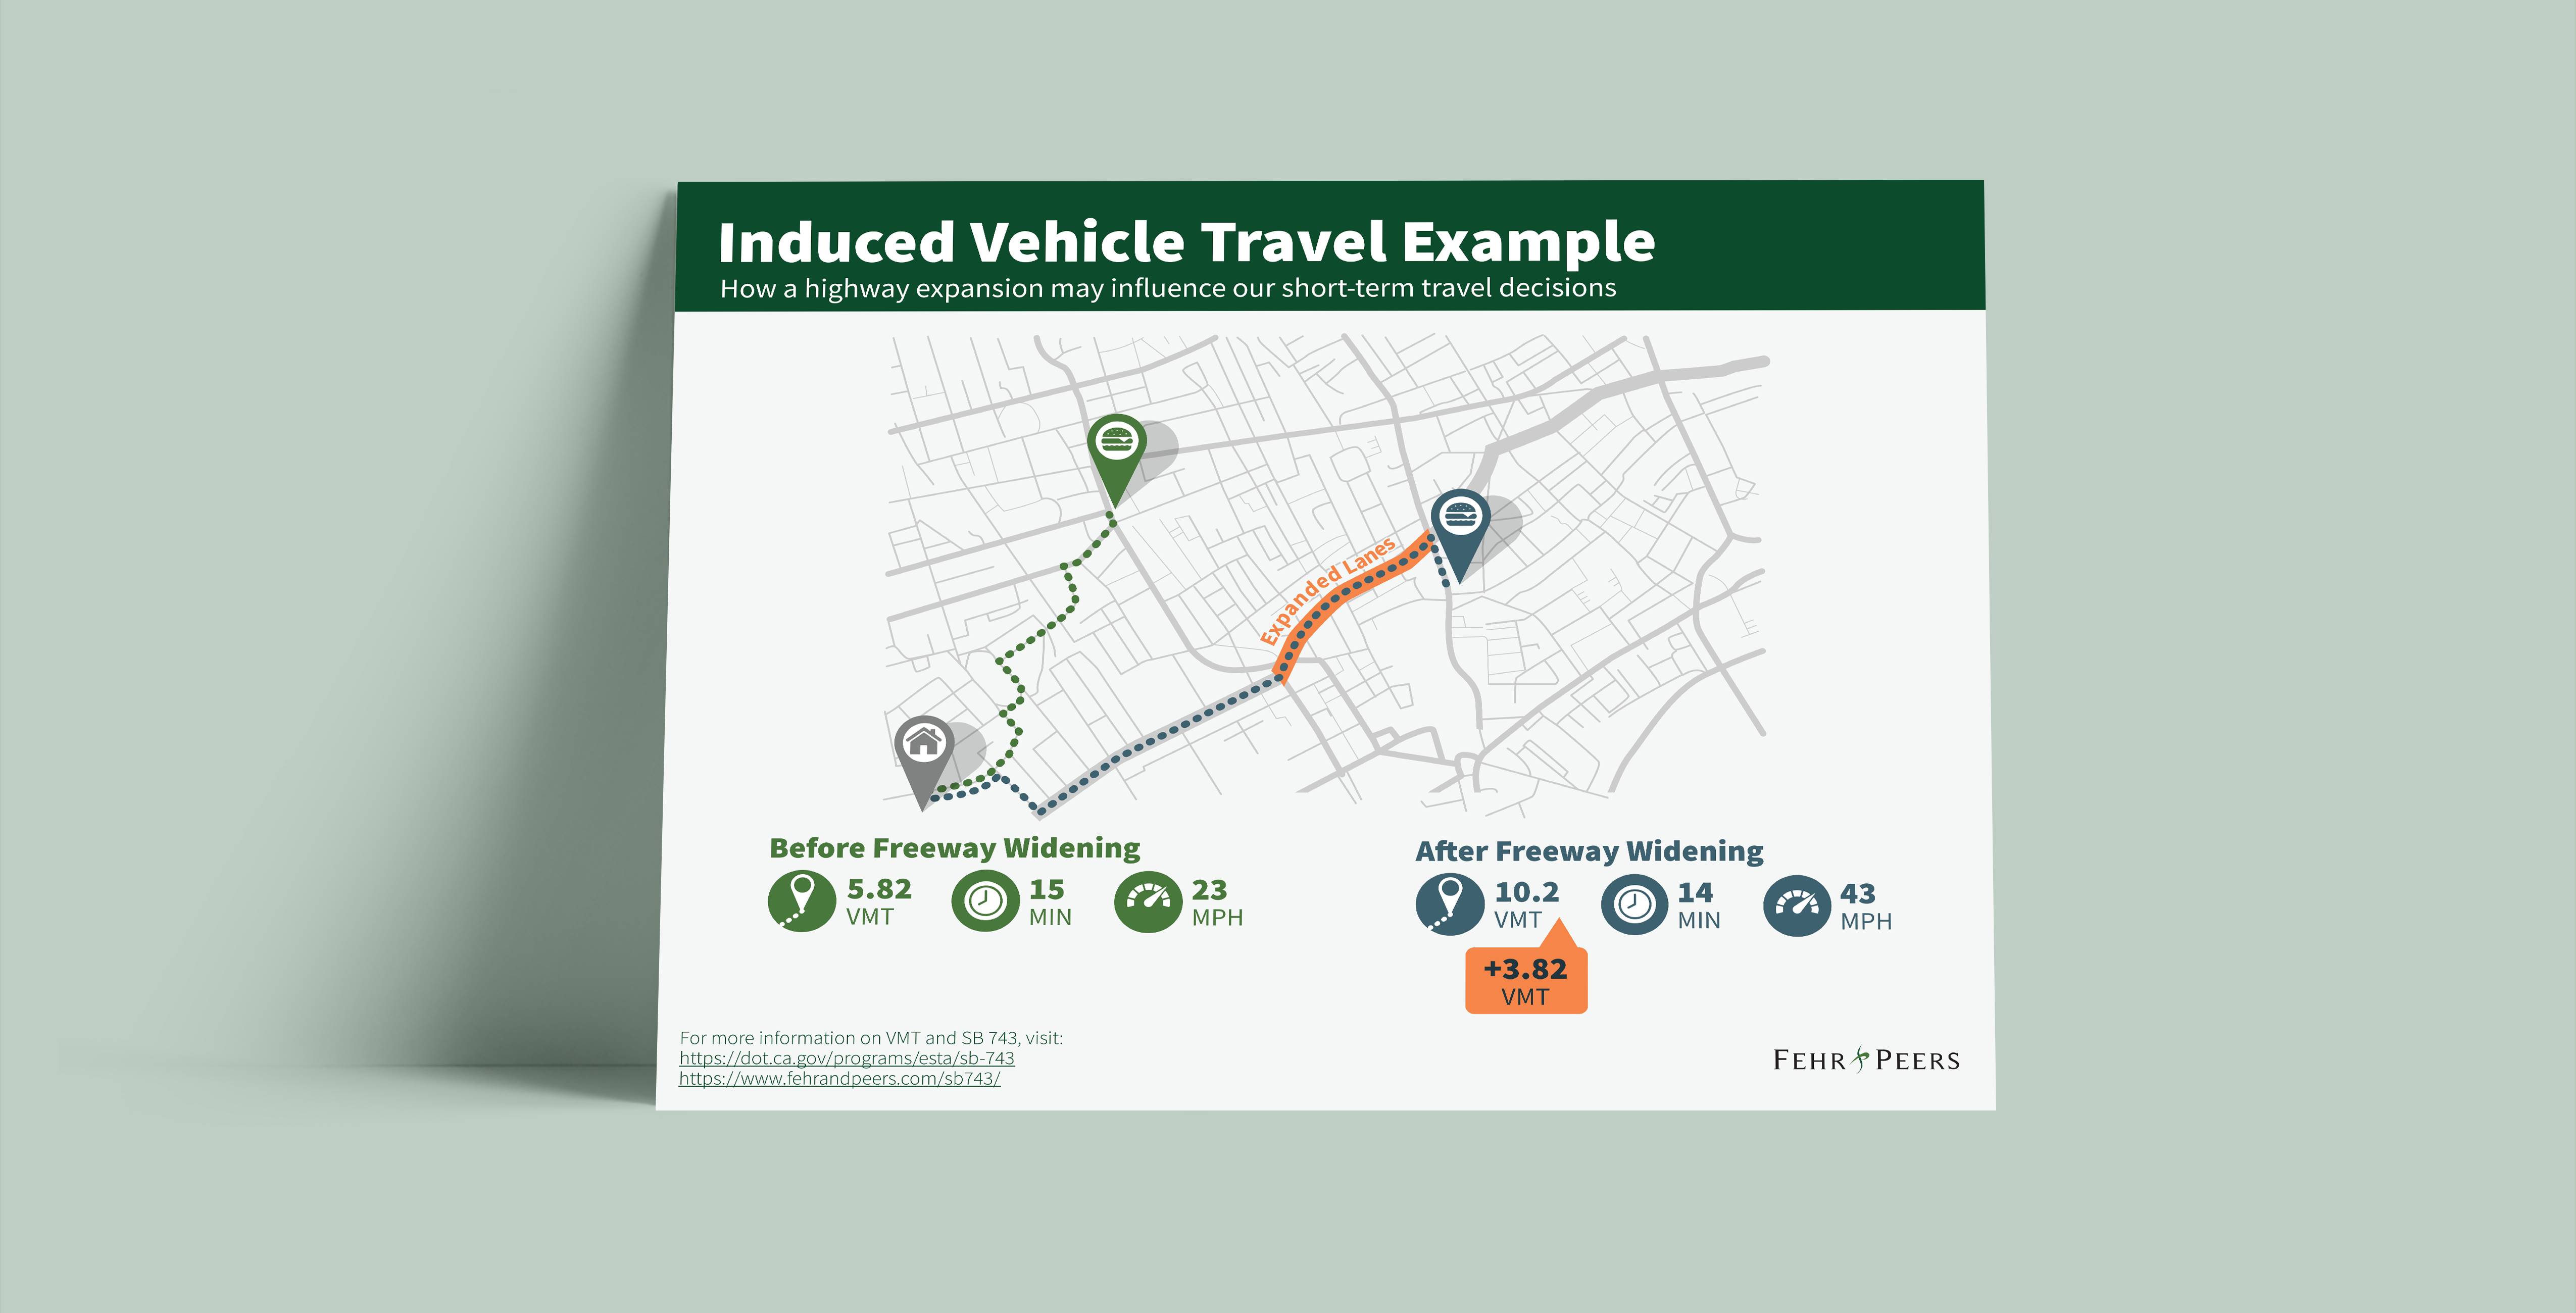
While efficiency metrics are most useful for land use project analysis, the expansion of roadways usually focuses just on the change to total VMT. The total VMT attributable to widening or building new roadways is known as induced vehicle travel effects. A variety of resources are available to explain the methodologies available to quantify induced VMT impacts.
U.S. Department of Transportation Federal Highway Administration Highway Project Traffic Forecasting Method Sheets (a catalog of methods for verifying travel model sensitivity and how to quantify land use and transportation effects of highway capacity projects)
Shifting from LOS

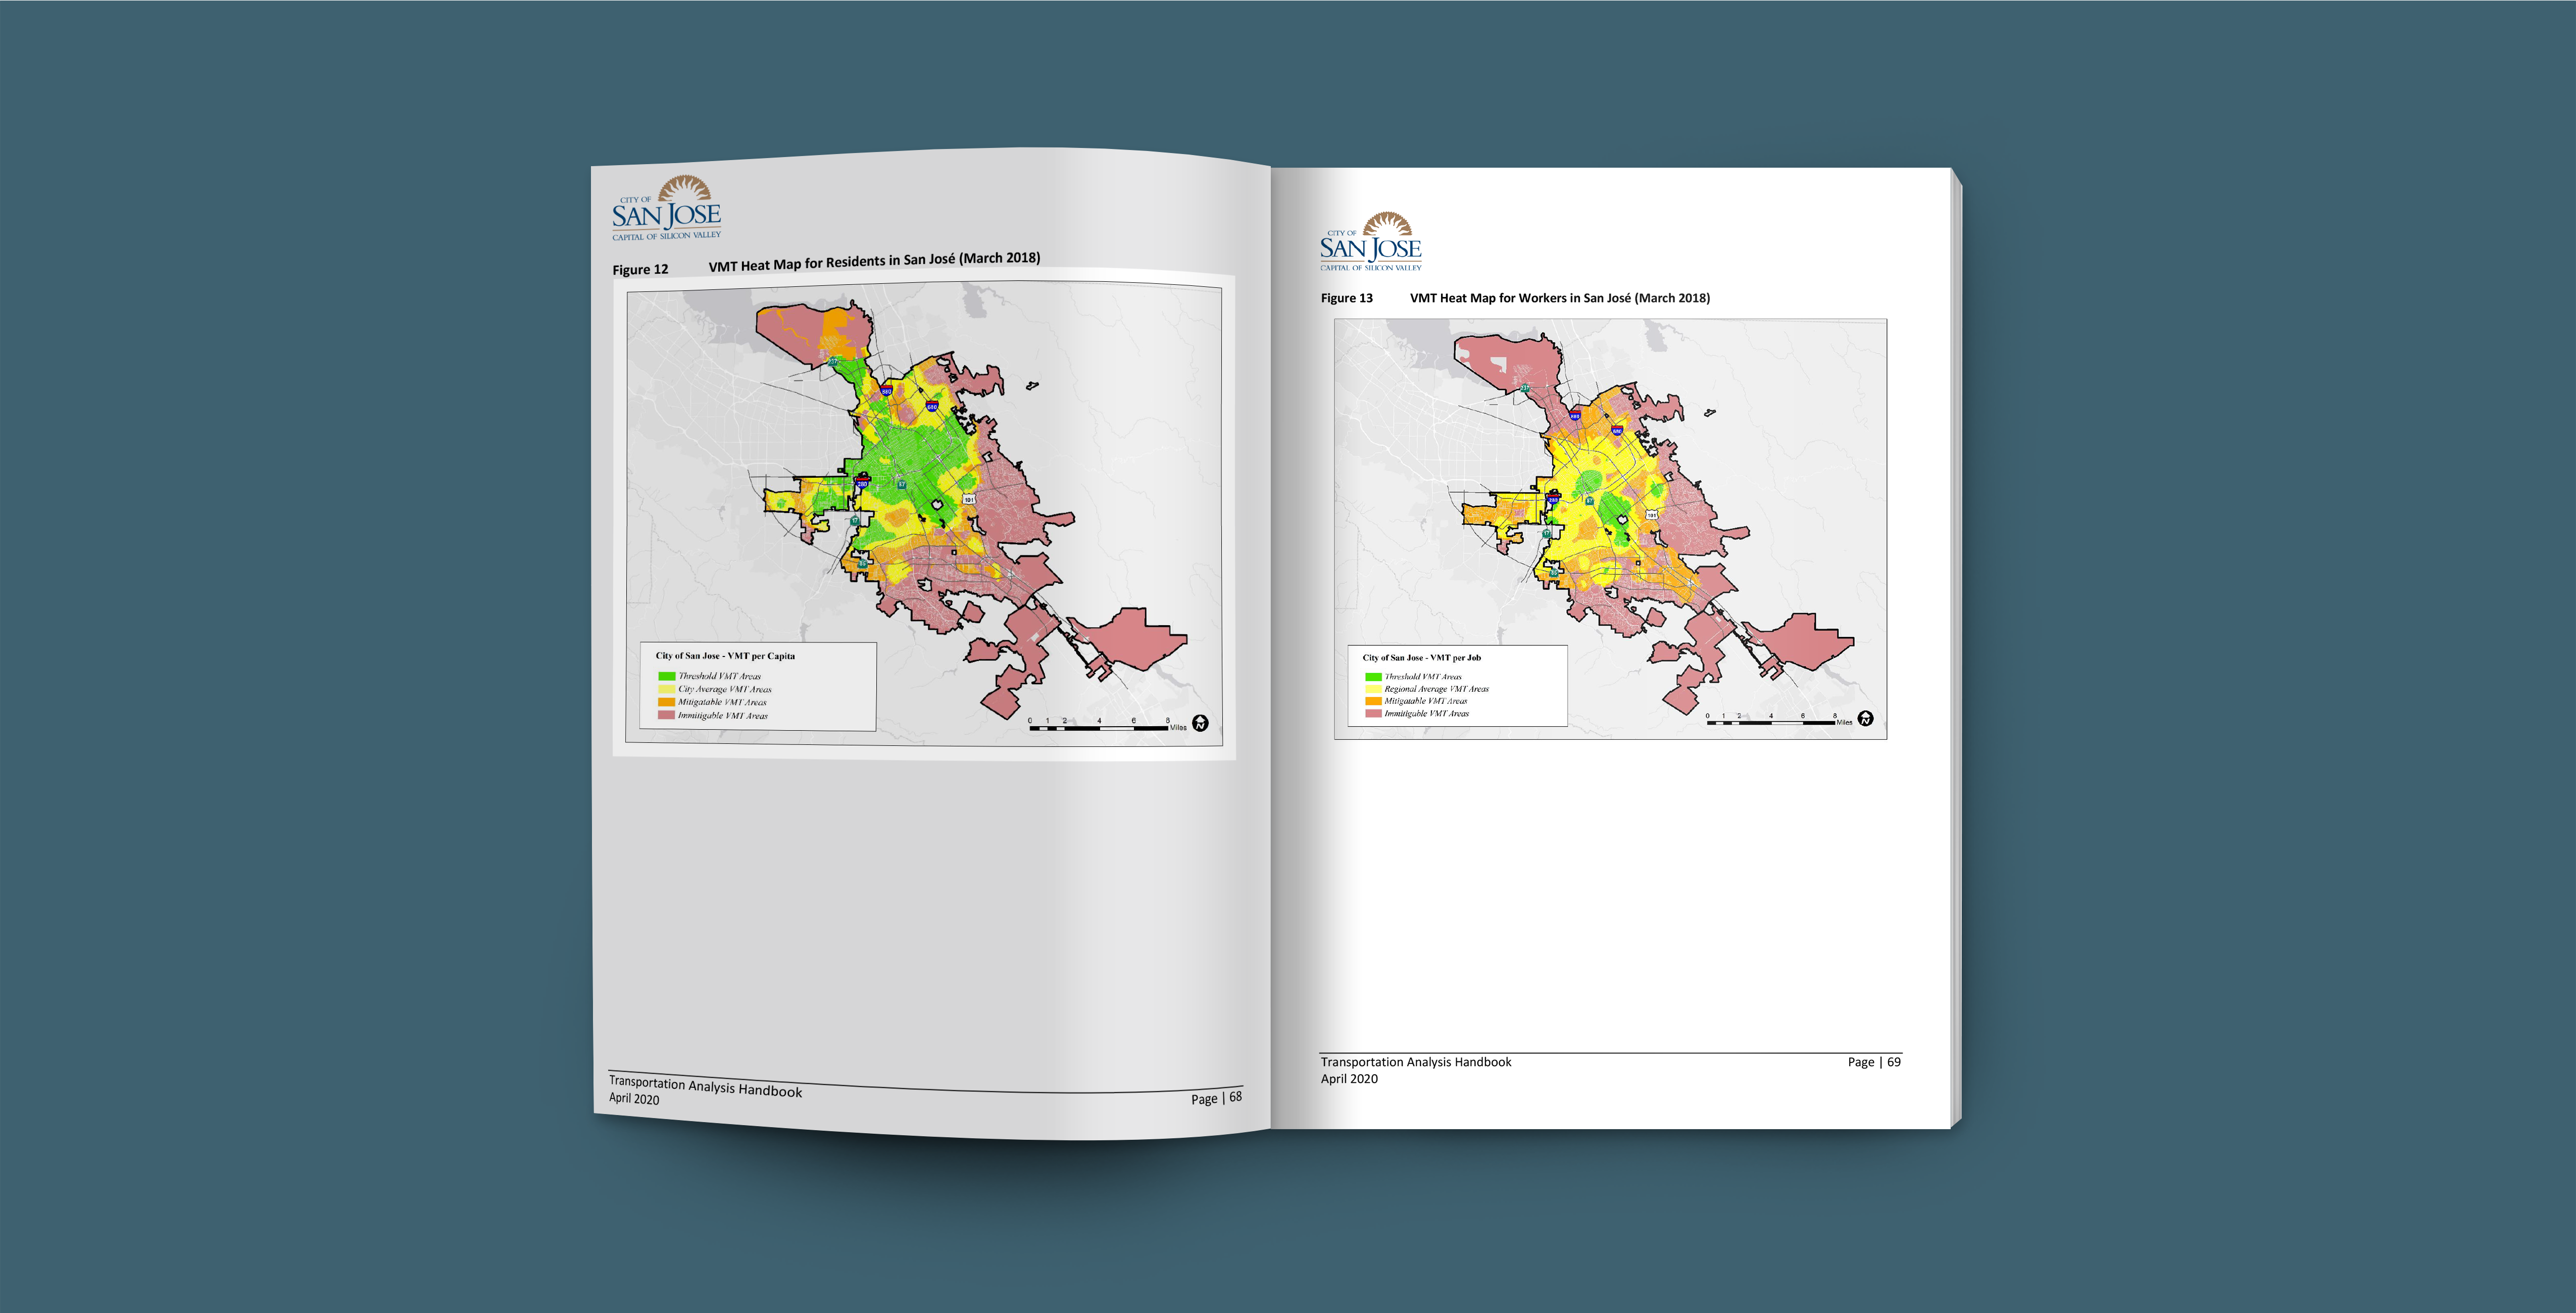
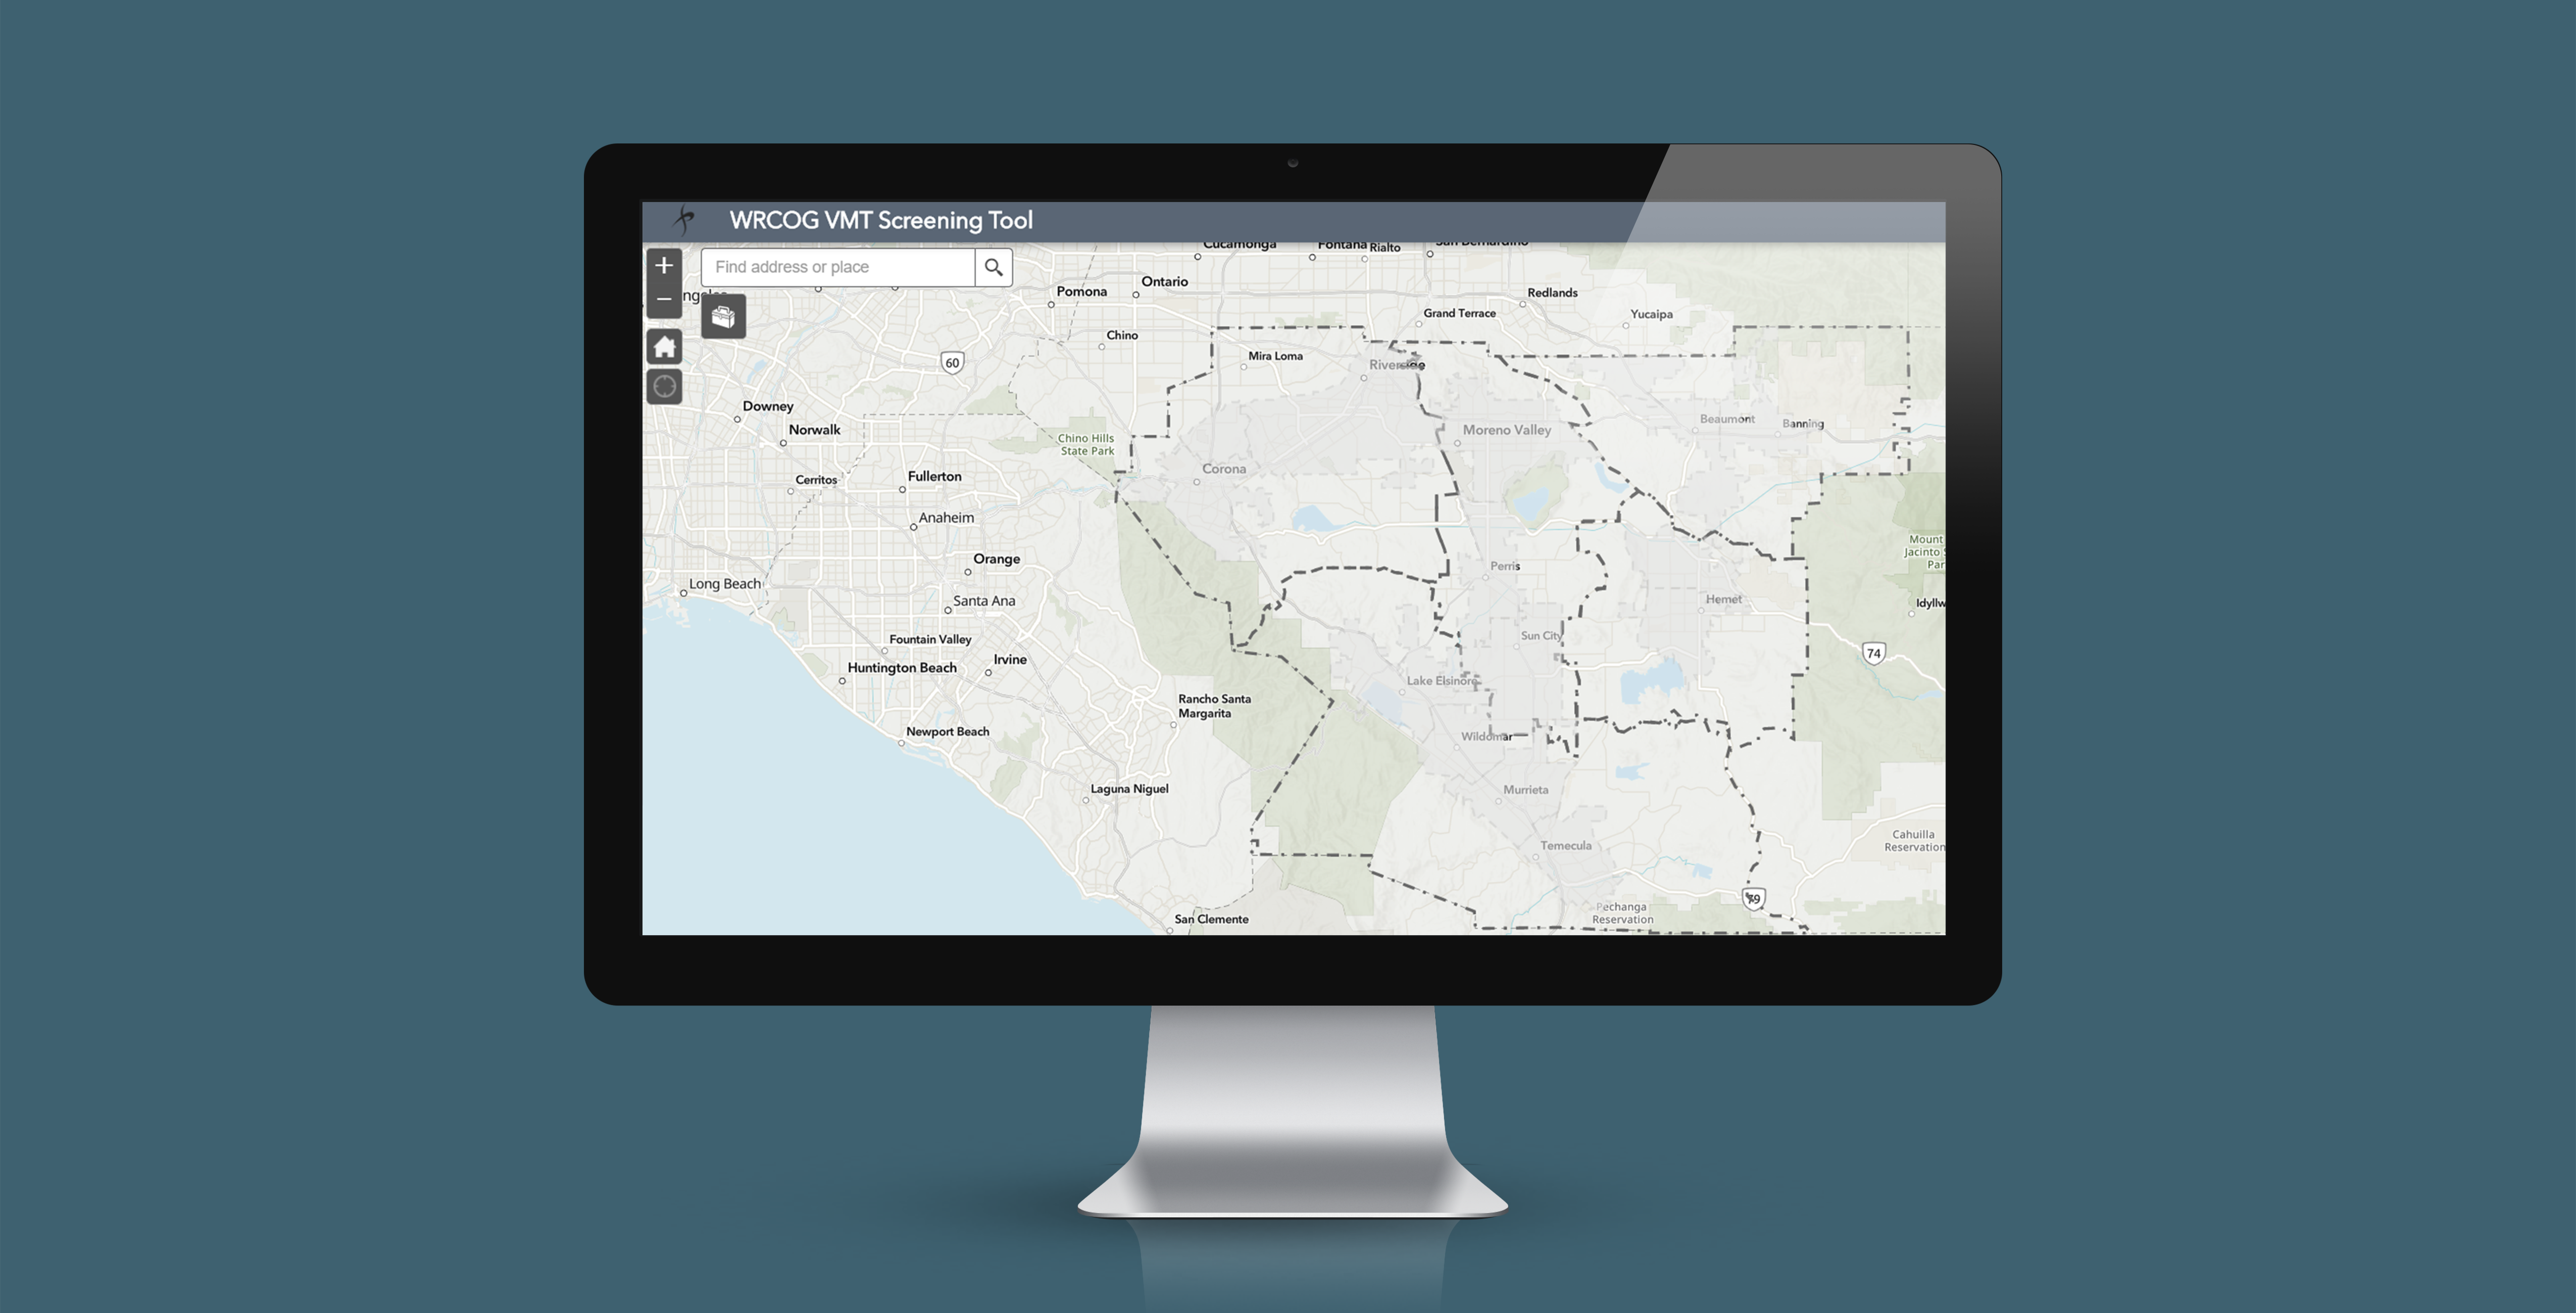
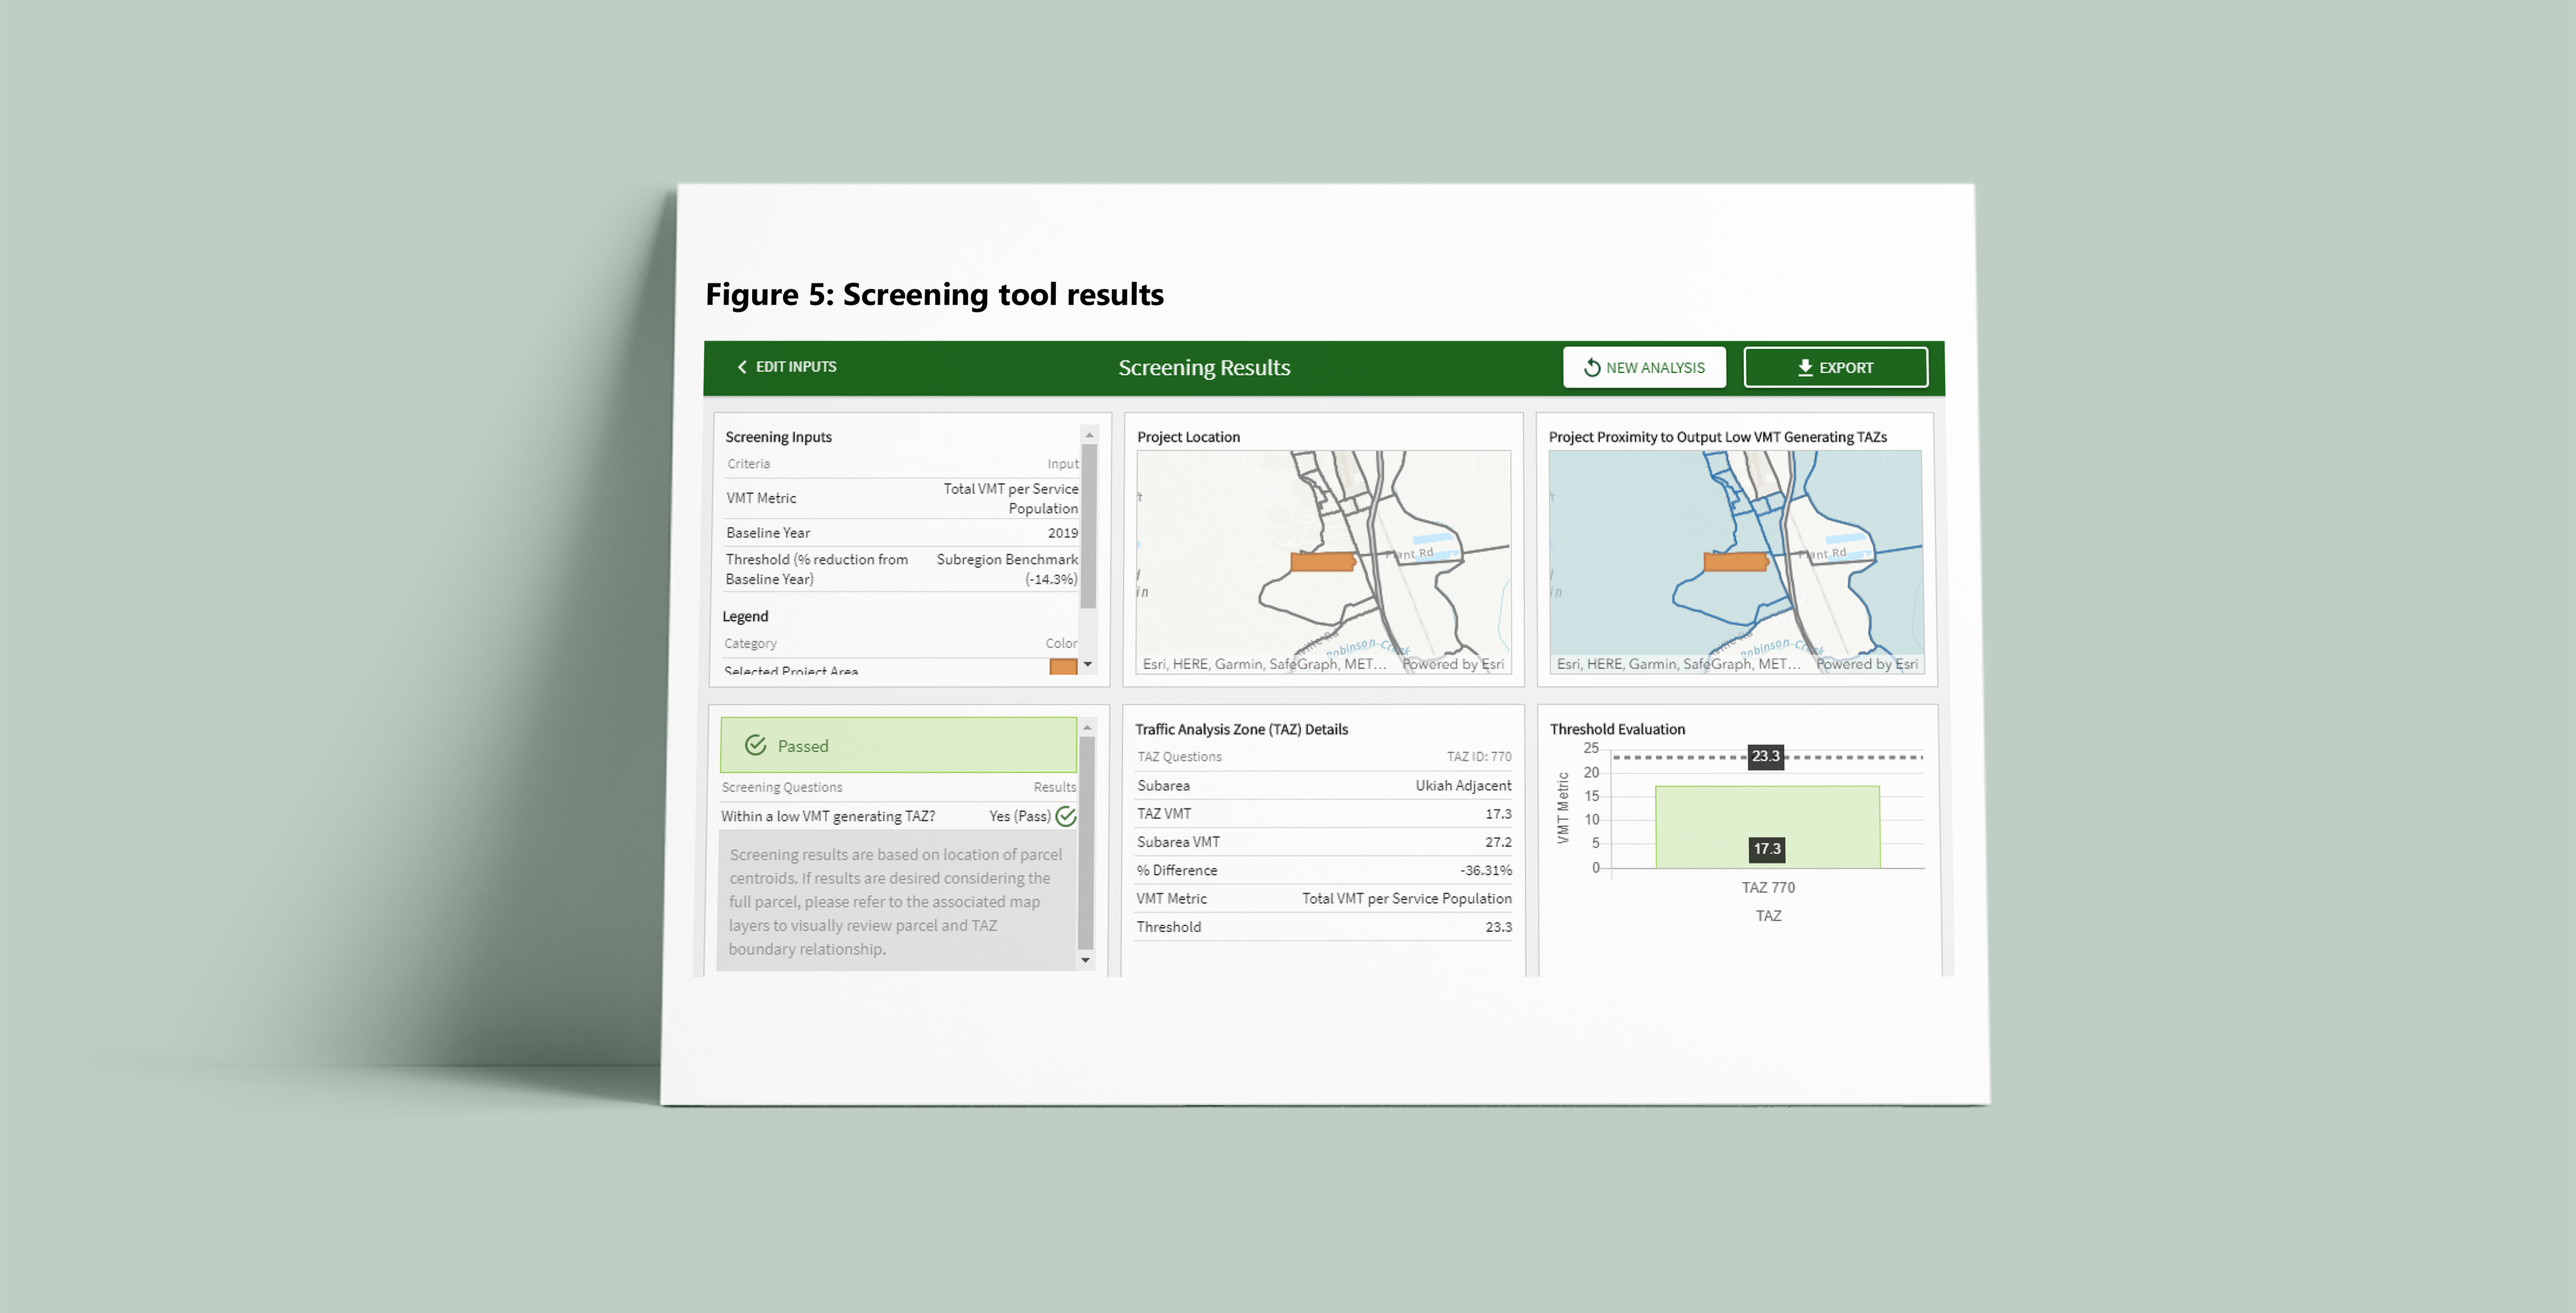
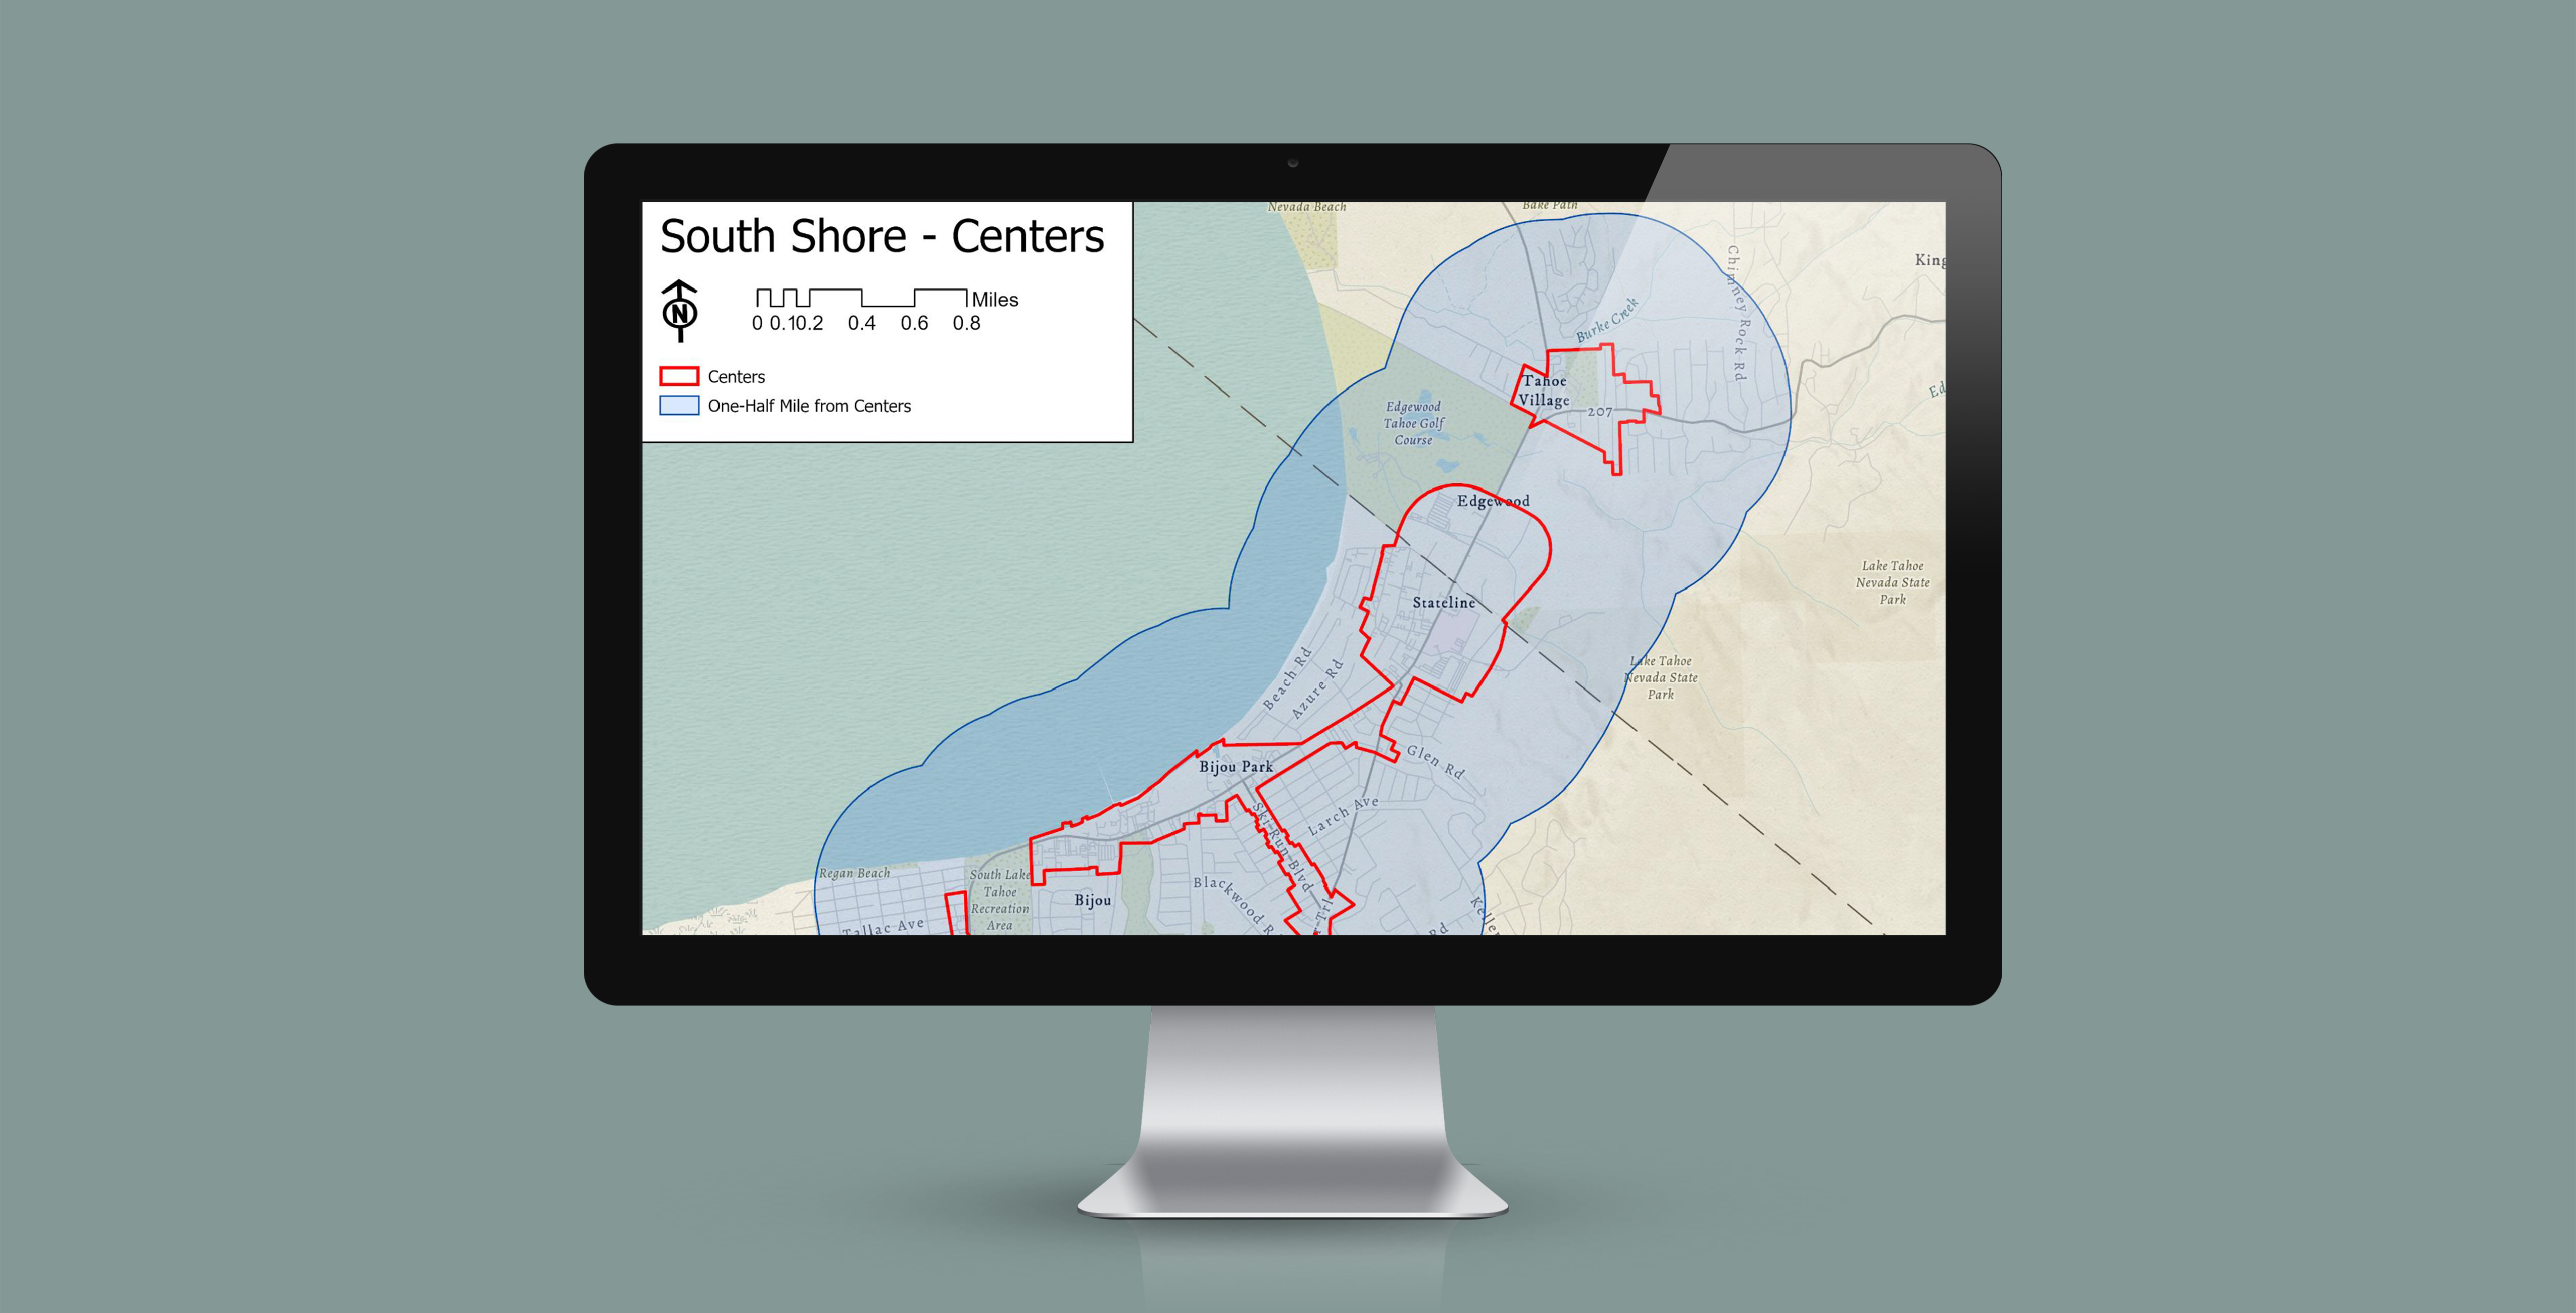
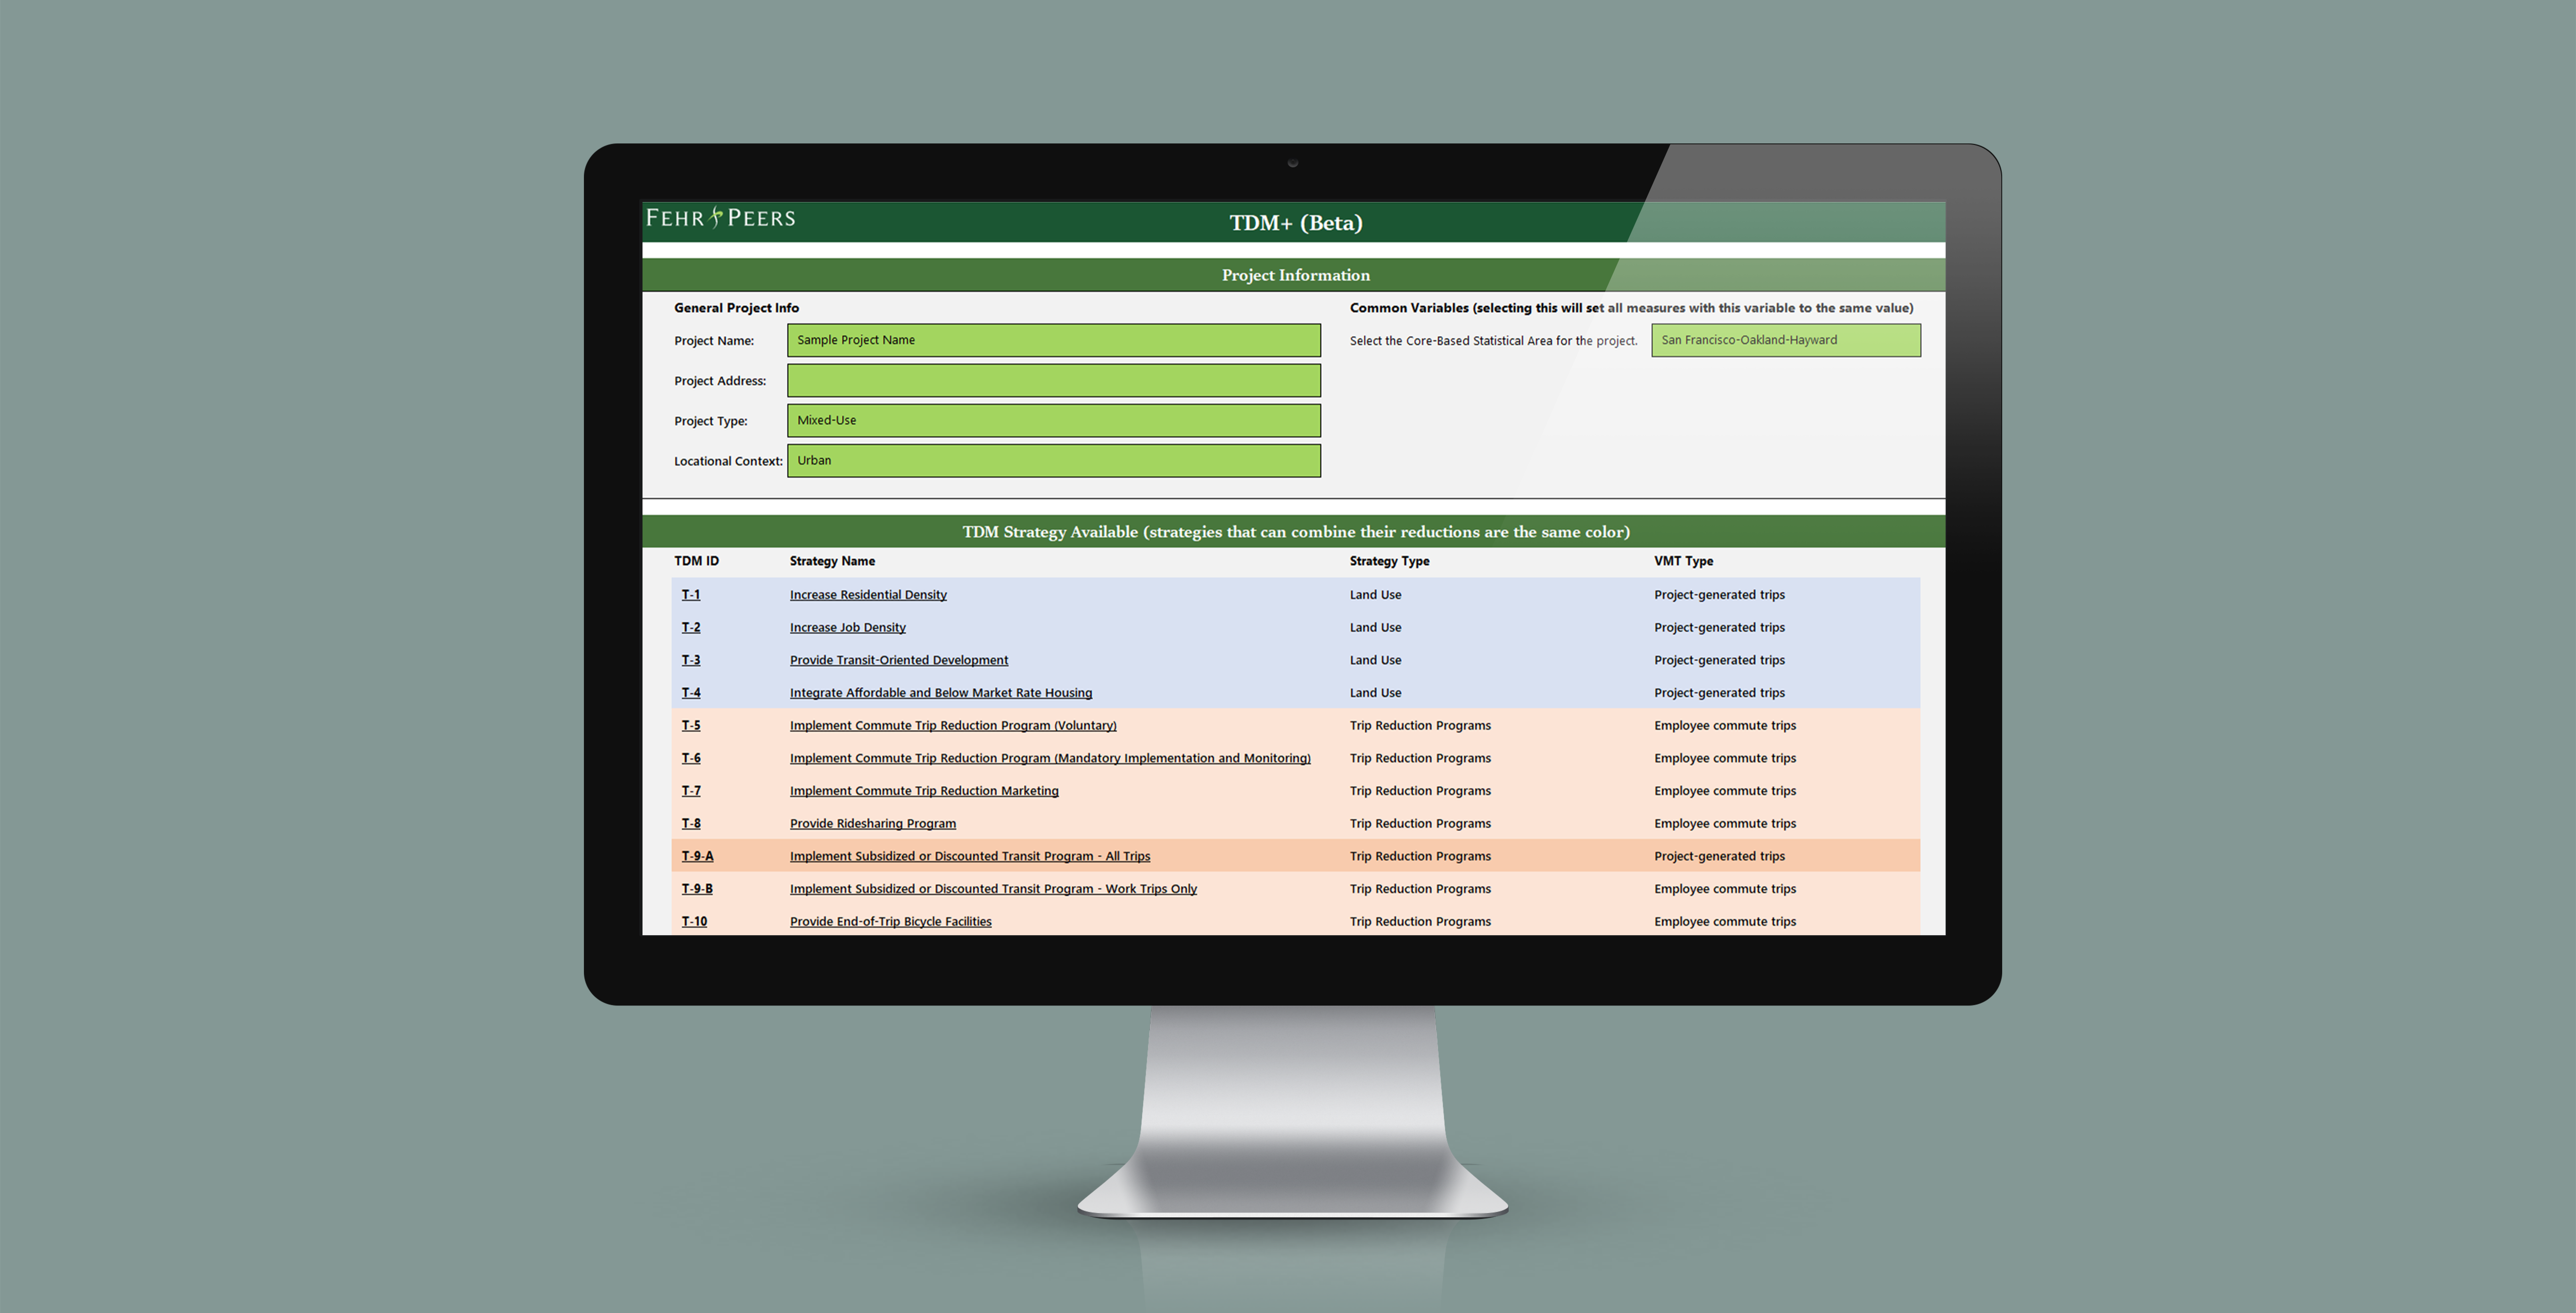
So far, we have partnered with over 350 public agencies in California, ranging from the state’s largest cities to rural counties, to develop VMT impact analysis procedures. We understand that each community faces unique challenges and opportunities. The examples below demonstrate how agencies in different land use contexts are approaching VMT impact analysis.
Urban
Suburban
Rural
Client Perspectives
Further Guidance
Interested in creating a customized VMT approach for your community?
Connect today with one of our experts: Ron Milam, Julie Morgan, Jason Pack, and Katy Cole.
Quick Links
© 2017 – 2024 Fehr & Peers. All rights reserved.

