Transforming what’s possible.
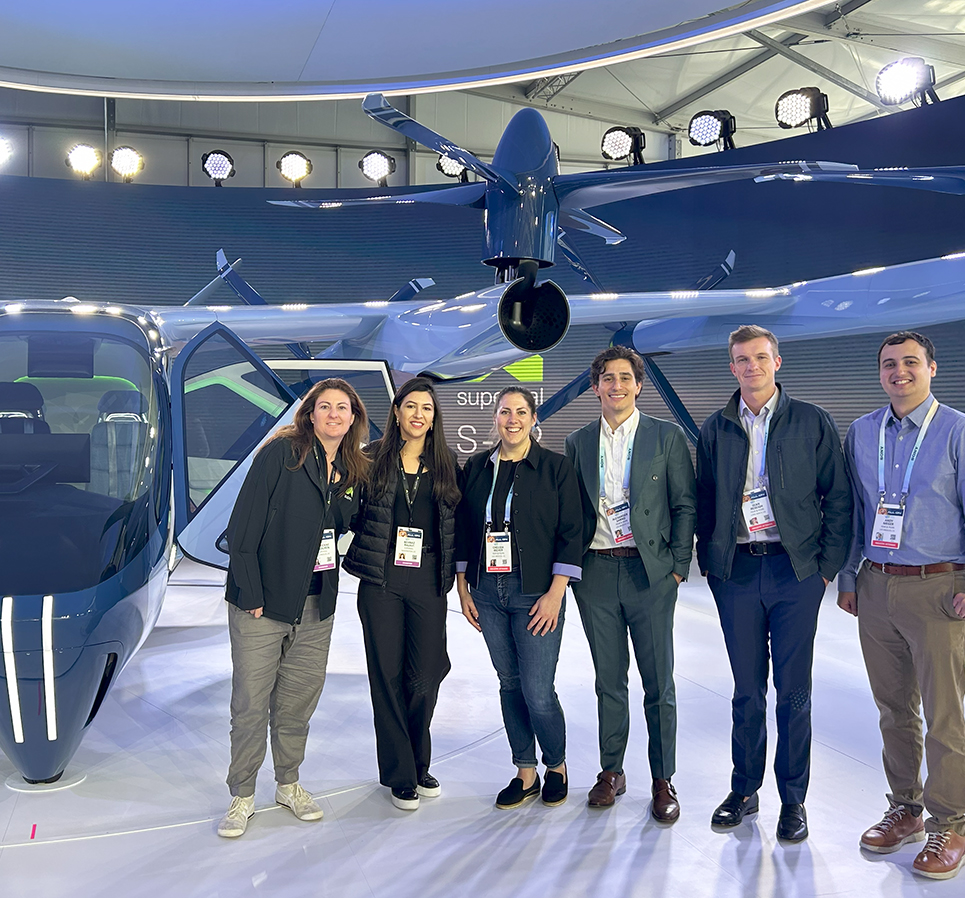
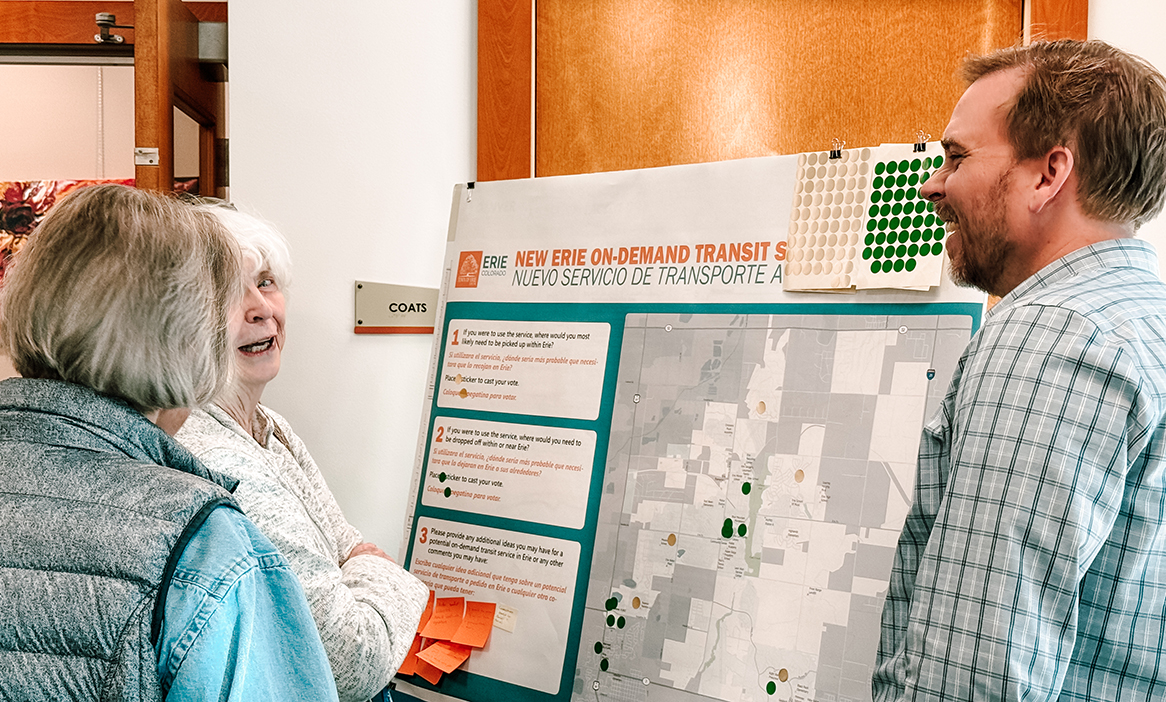
We don’t just respond to current challenges — we collaborate with clients and industry peers to anticipate future needs.
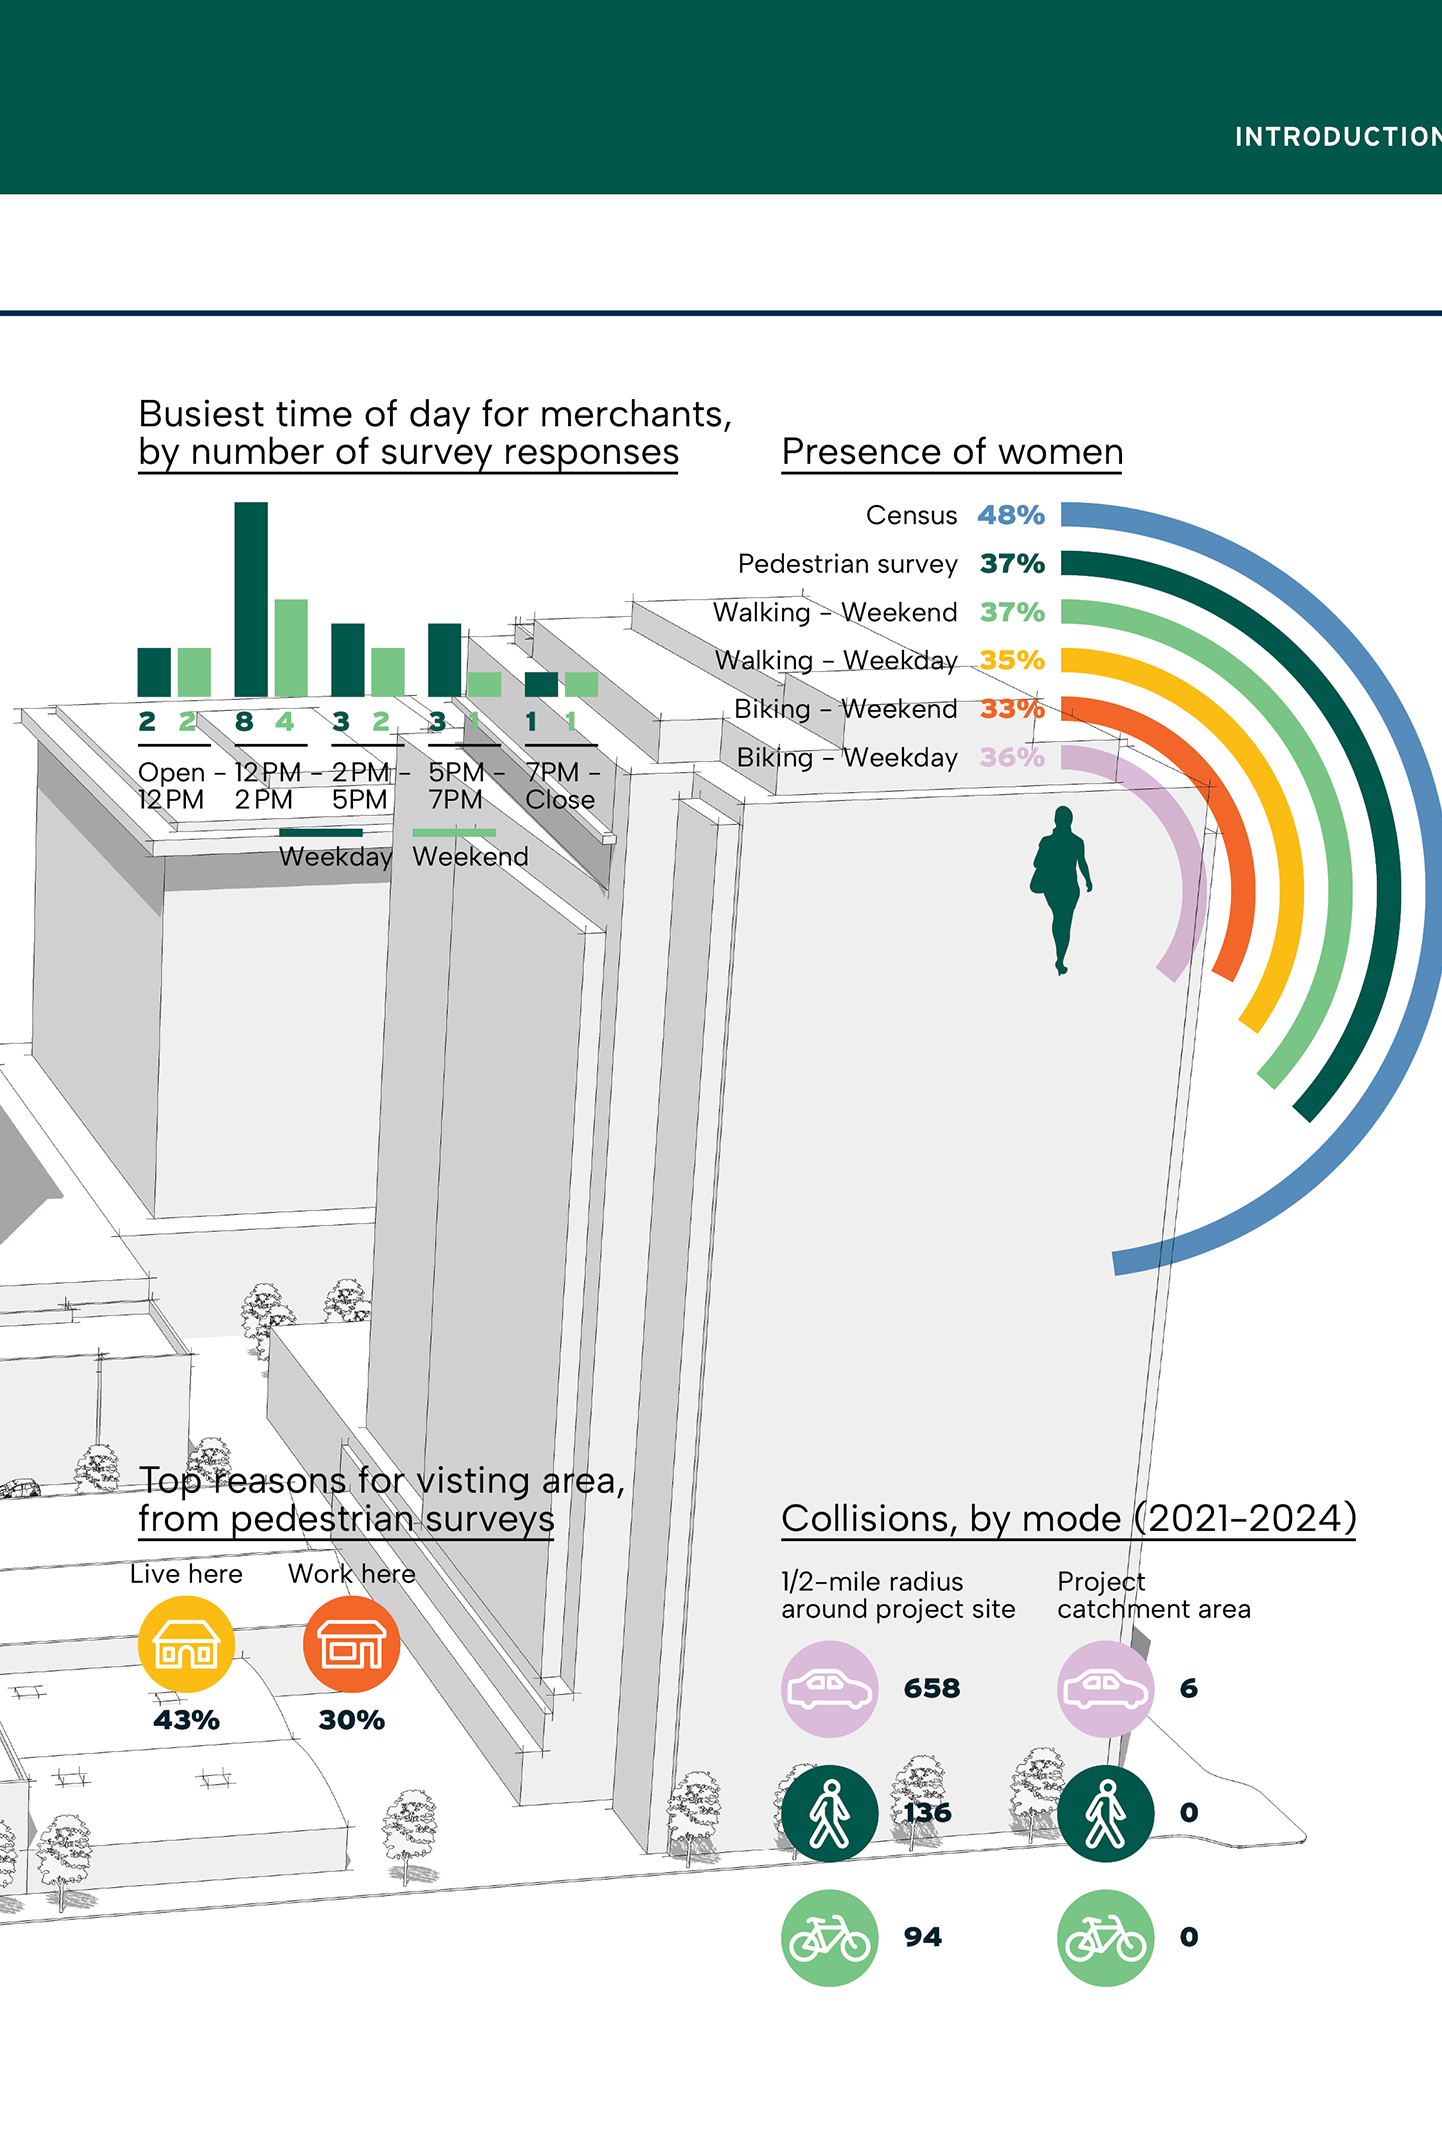
By combining cutting-edge technology with the individual stories and lived experiences of people in the communities we serve, our data-driven strategies empower clients to make decisions that hold up to scrutiny and deliver lasting results.
We don’t just respond to current challenges — we collaborate with clients and industry peers to anticipate future needs.


By combining cutting-edge technology with the individual stories and lived experiences of people in the communities we serve, our data-driven strategies empower clients to make decisions that hold up to scrutiny and deliver lasting results.
- 100%
We invest in R&D that moves the industry forward.
Each year, we dedicate significant internal time and resources to R&D—not as an add-on but as a core part of how we work. This ongoing investment helps us explore new ideas, test emerging technologies, and deliver solutions that help our clients navigate complexity and lead lasting change.
- 100%
Innovation, powered from within.
Most of our staff actively contribute to R&D—developing tools, solving problems, and advancing ideas across disciplines. Their work doesn’t just improve how we operate—it drives ideas that respond to real challenges and evolve with the world around us.
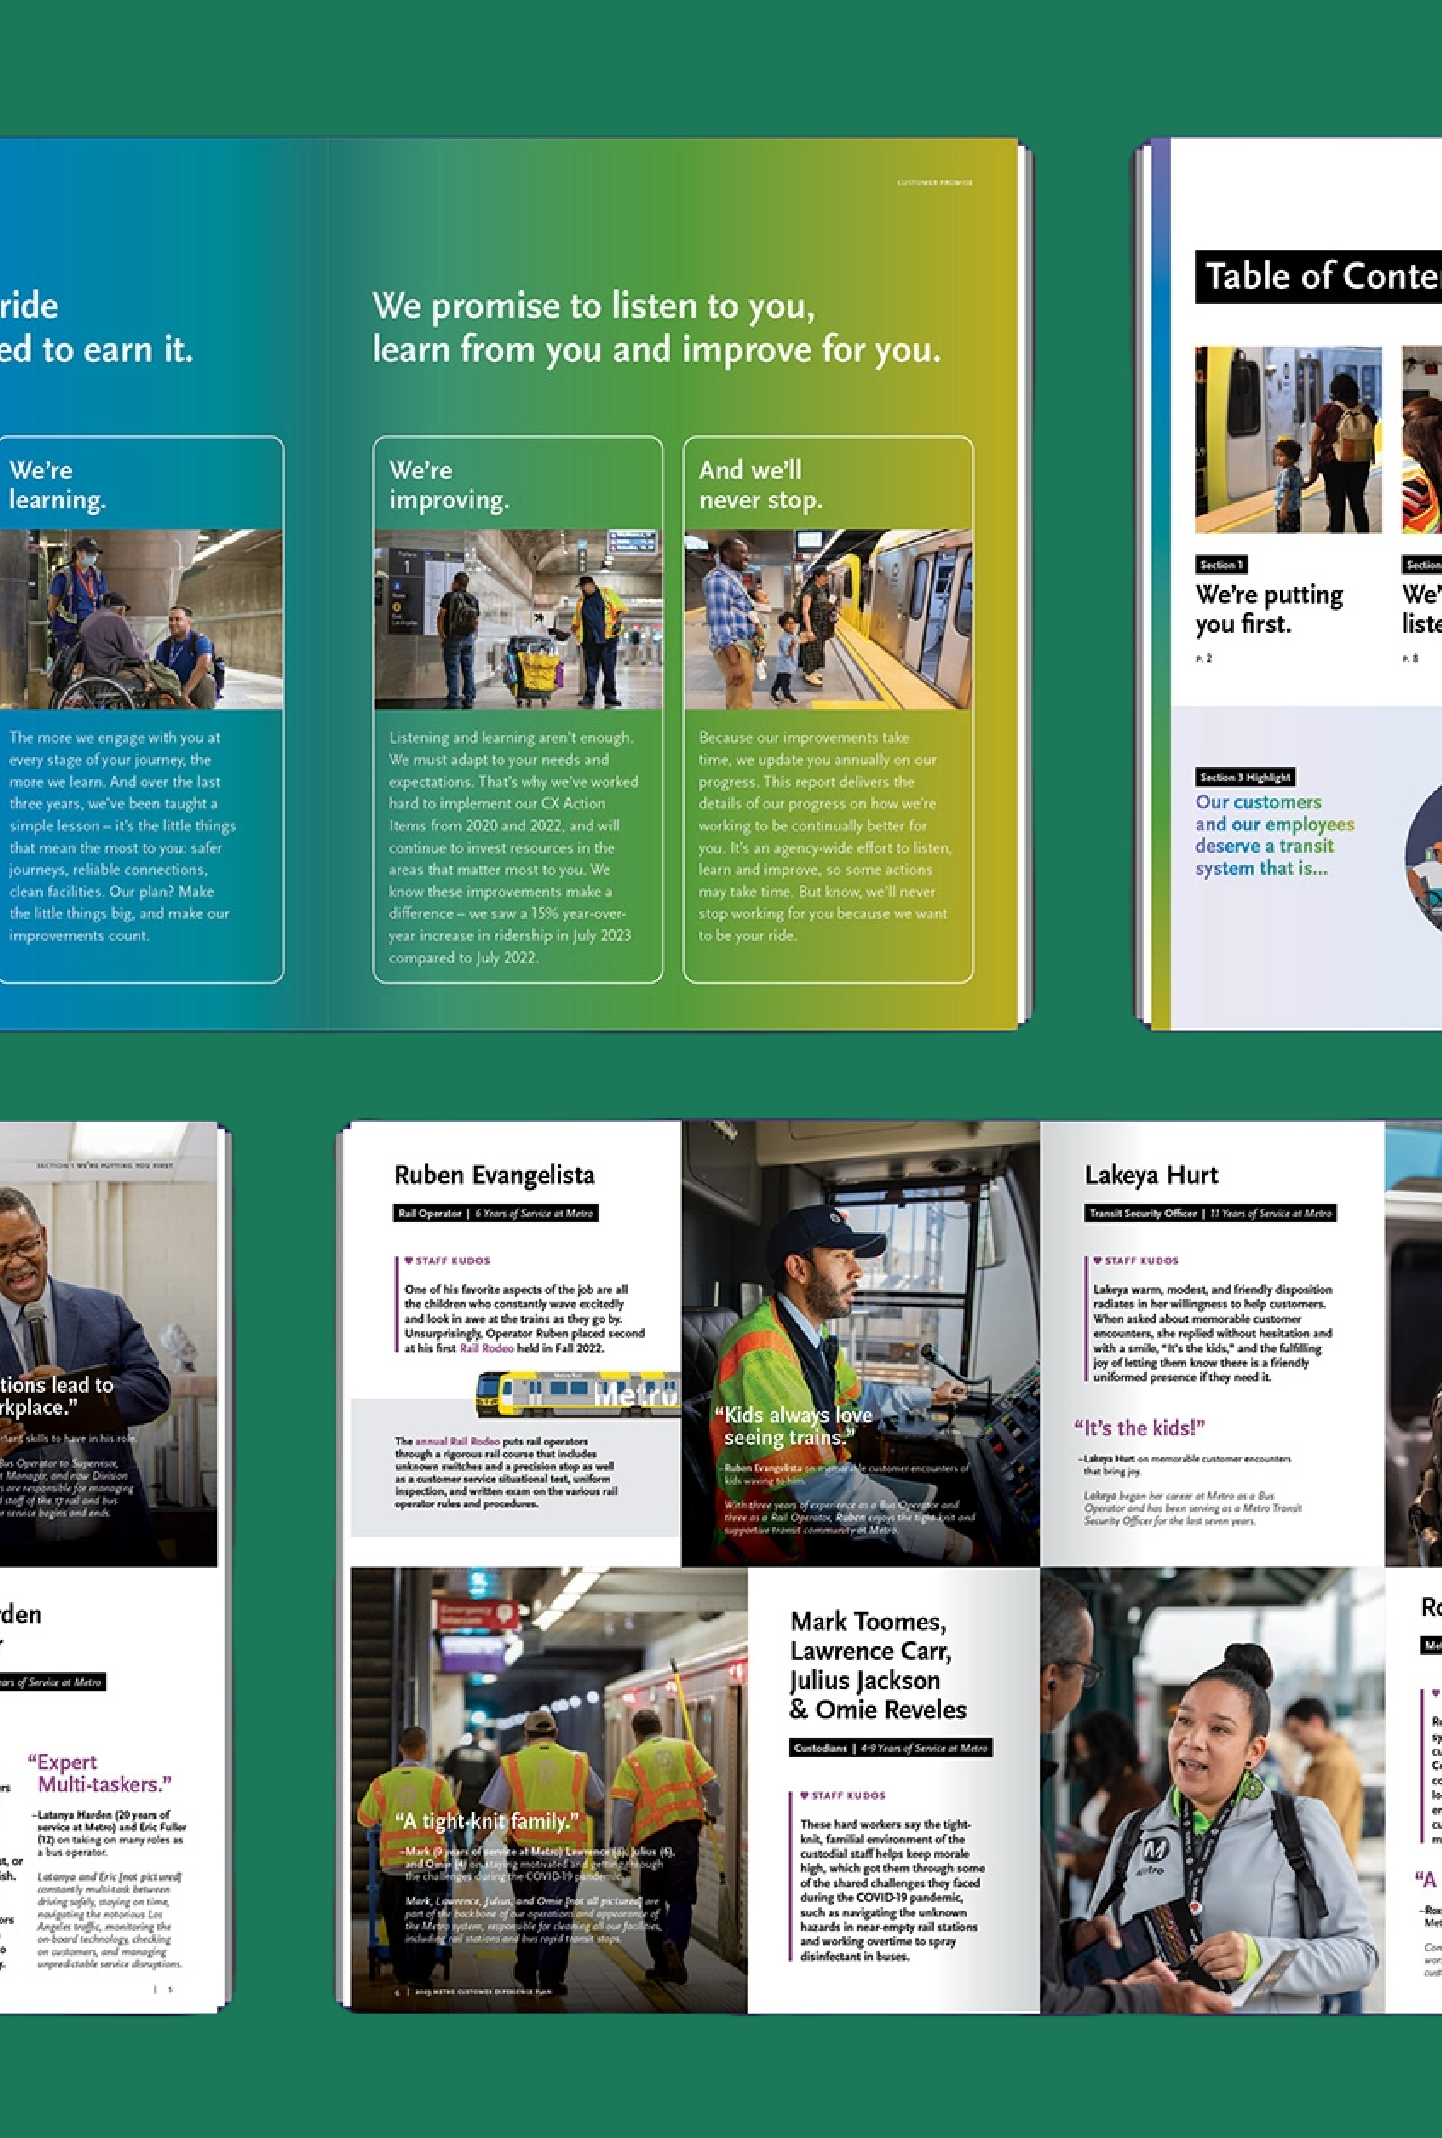
Advancing the practice of how
to reduce VMT. to move goods and freight. to make transit more reliable. kids get to school. to move safely. to forecast demand for travel. people evacuate in a disaster. to deliver mobility justice. to provide universal access. to manage private mobility services. to leverage AI. people walk. people bike. people ride. people drive. to reconnect communities.
Our Suite of Tools
We’ve developed custom tools to tackle a wide range of transportation challenges, often tailored to meet the needs of specific communities. Built on nationwide experience, they deliver quick, data-driven insights and support decision-making through analysis, scenario testing, and planning guidance. Here’s an overview of how our tools are used, grouped by the types of challenges they help solve.
Your Title Goes Here
Your content goes here. Edit or remove this text inline or in the module Content settings. You can also style every aspect of this content in the module Design settings and even apply custom CSS to this text in the module Advanced settings.
Evacuation & Resilience
Our tools model evacuation trips to show how traffic builds over time, where bottlenecks form, and how long it may take to clear an area, supporting safer, more efficient emergency planning.
They also map how disasters like wildfires and floods cut off access to evacuation routes and resilience hubs, helping communities plan for stronger recovery and communications strategies.
Freight & Parking
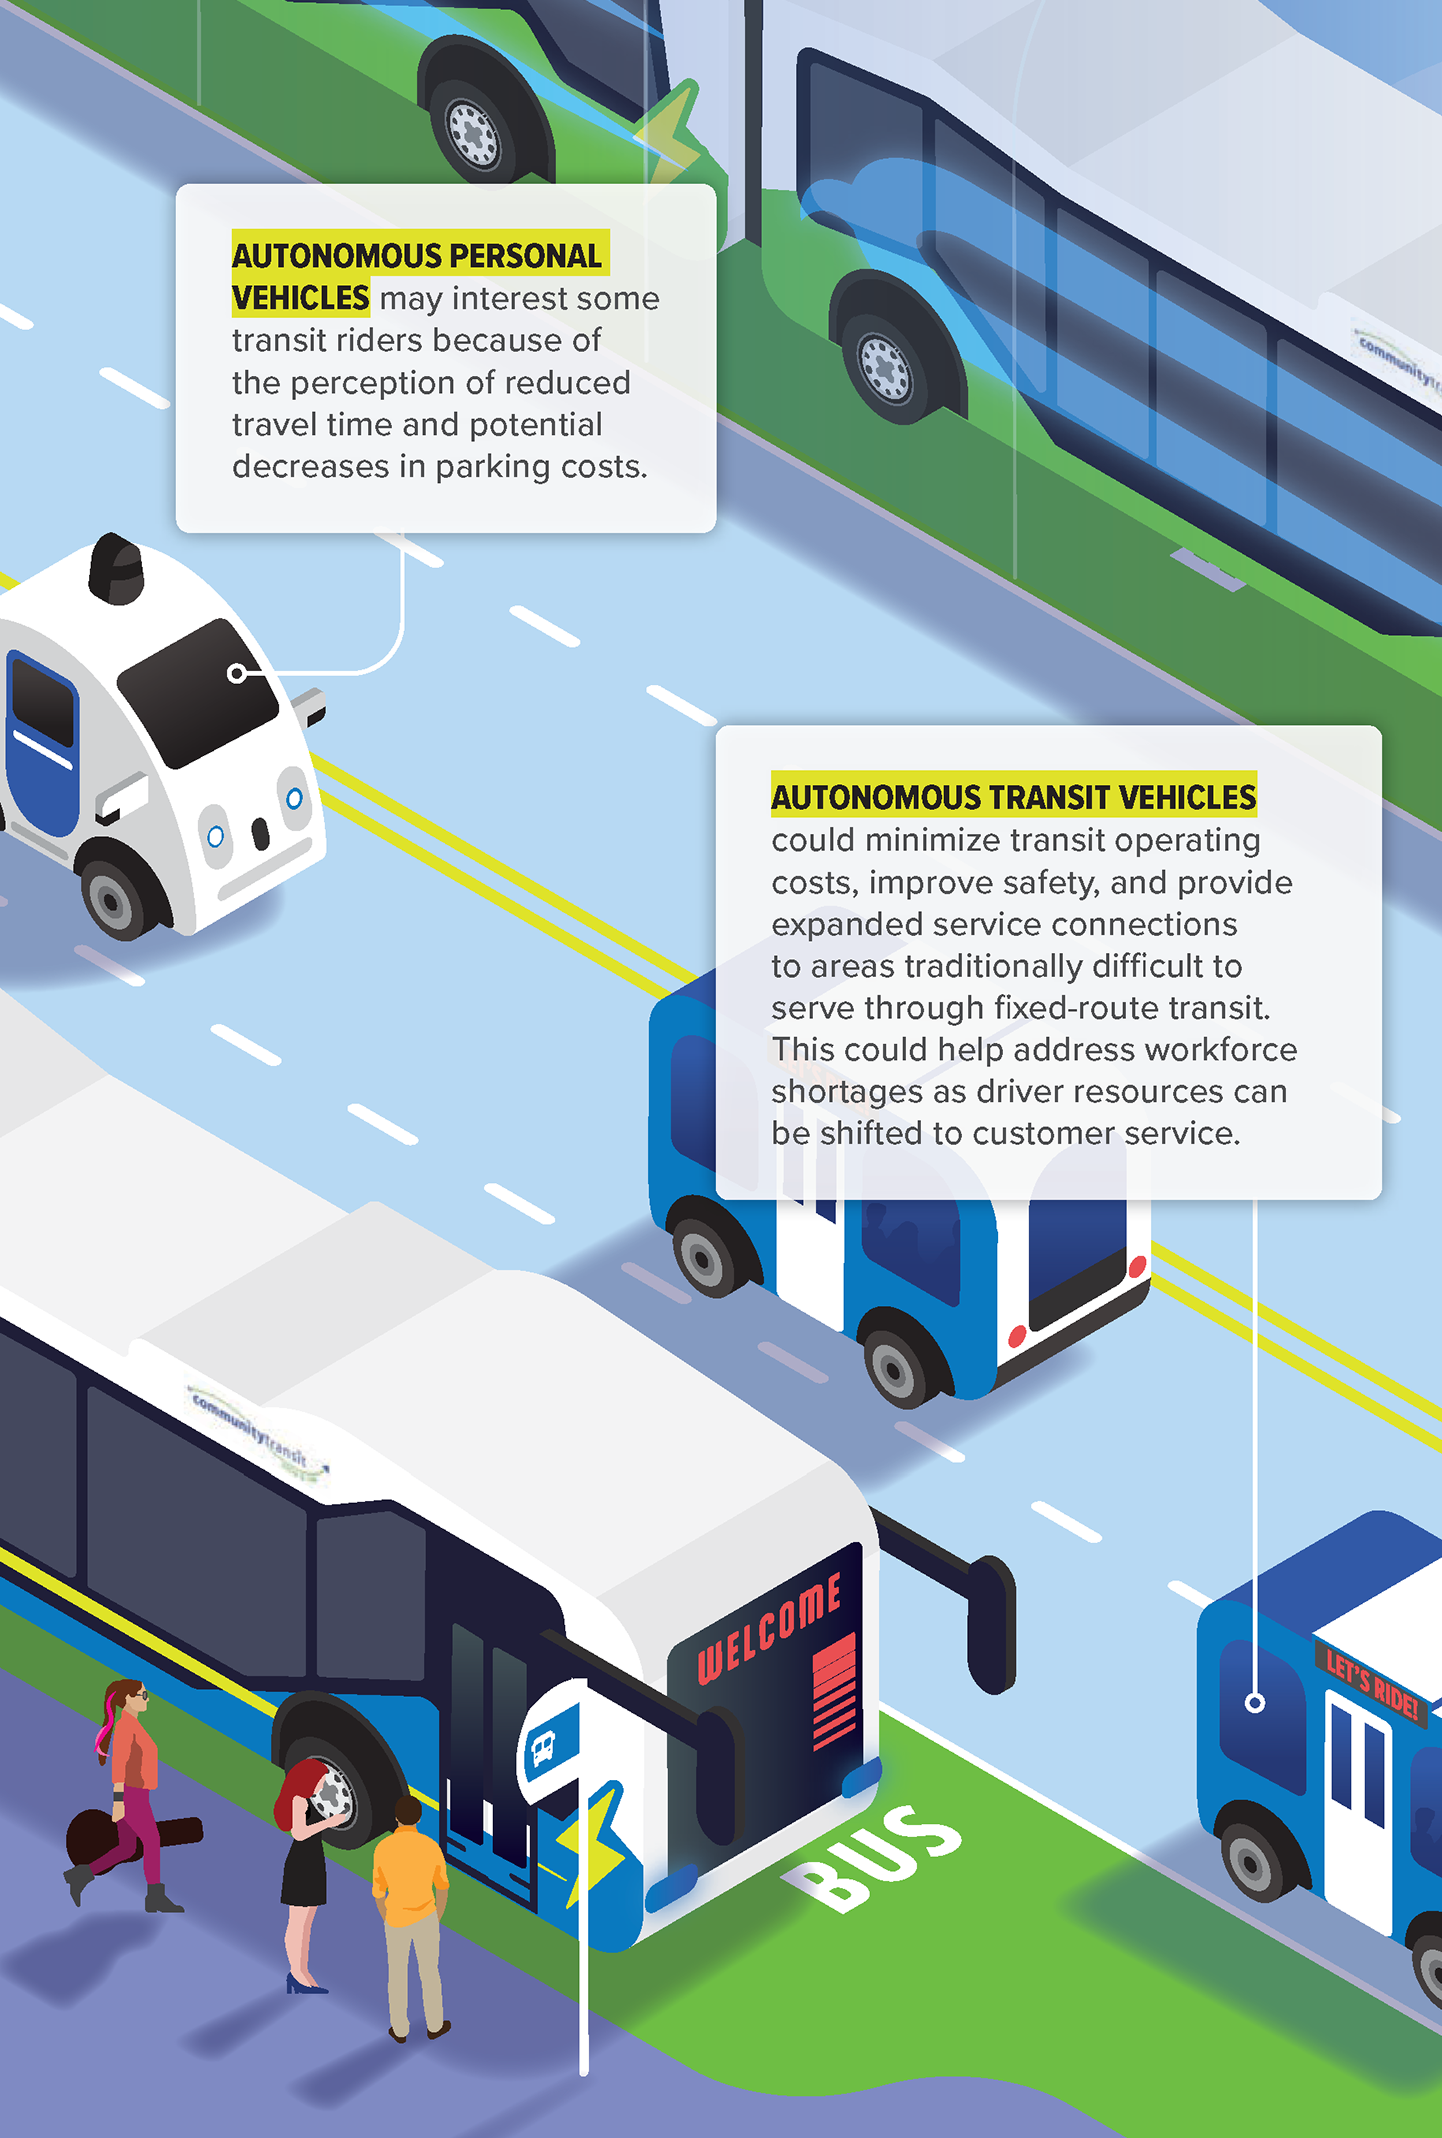
These tools analyze how deliveries, ride-hailing, and autonomous vehicles impact curb demand, allowing cities to test scenarios and design flexible curbside solutions.
Pedestrian & Bicycle
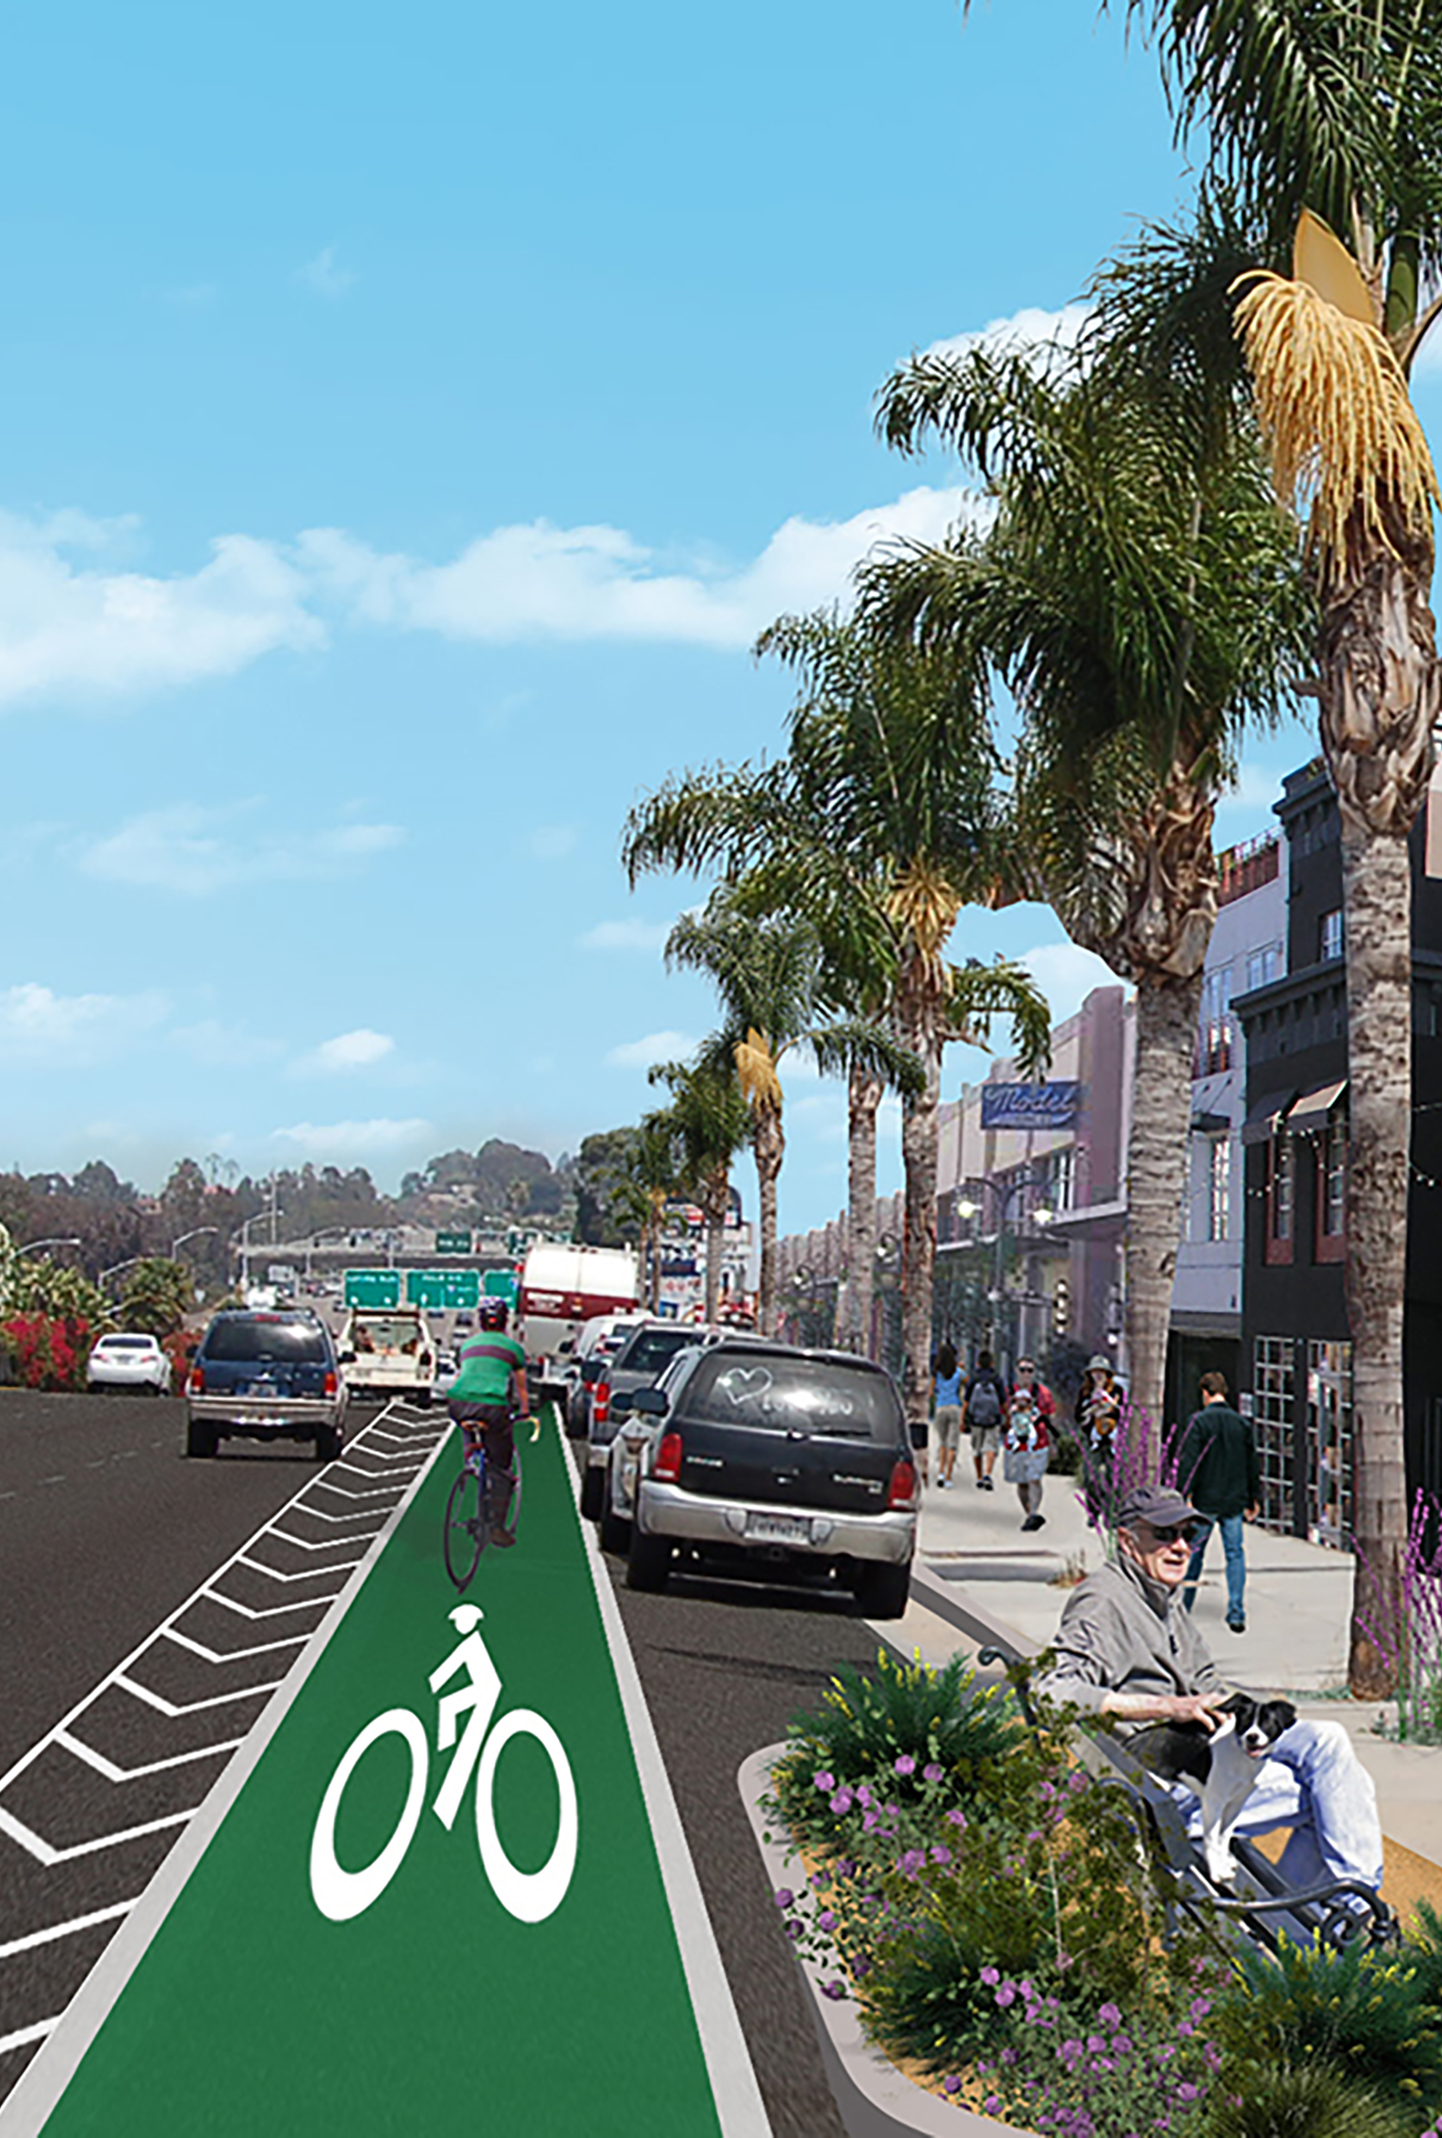
They also measure how comfortable streets feel for walking and biking, helping design spaces that are more welcoming, safe, and accessible for everyone.
Safety
Transit
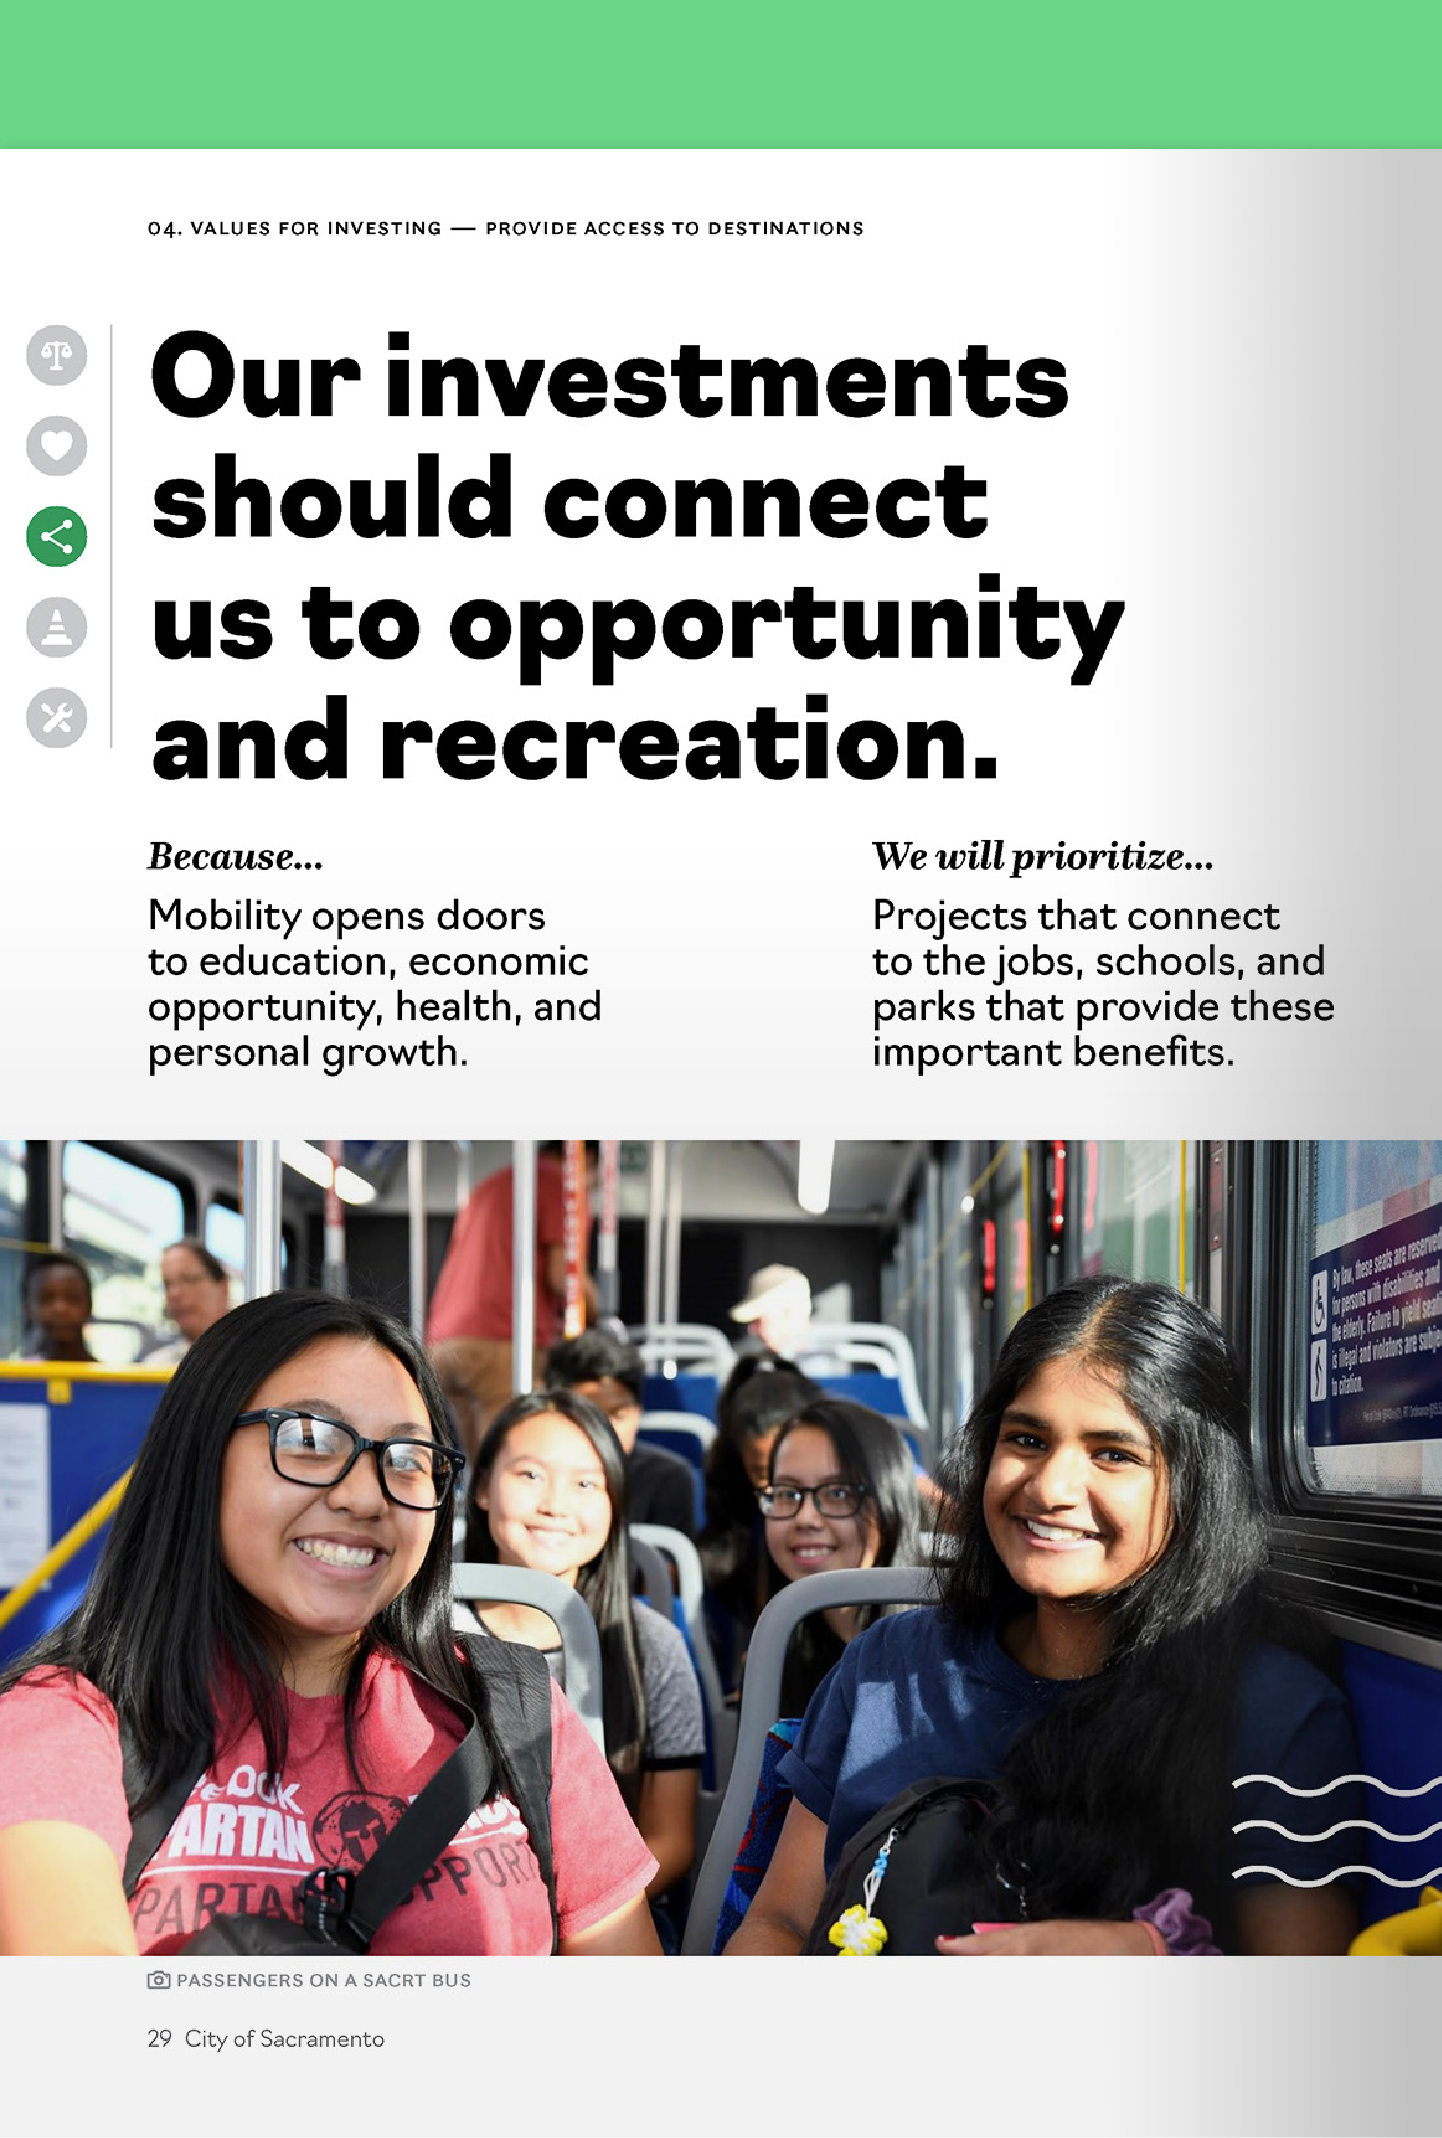
They also forecast how many people are likely to use transit stations, based on walkability, land use, and accessibility, supporting stronger community connections.
Travel Behavior
Our models estimate how many car trips happen in areas with housing, shops, and offices, factoring in walking access and nearby destinations to support more sustainable development.
They also evaluate the impact of strategies like adding buses, bike lanes, or carpooling, helping reduce traffic and emissions in ways tailored to local needs.
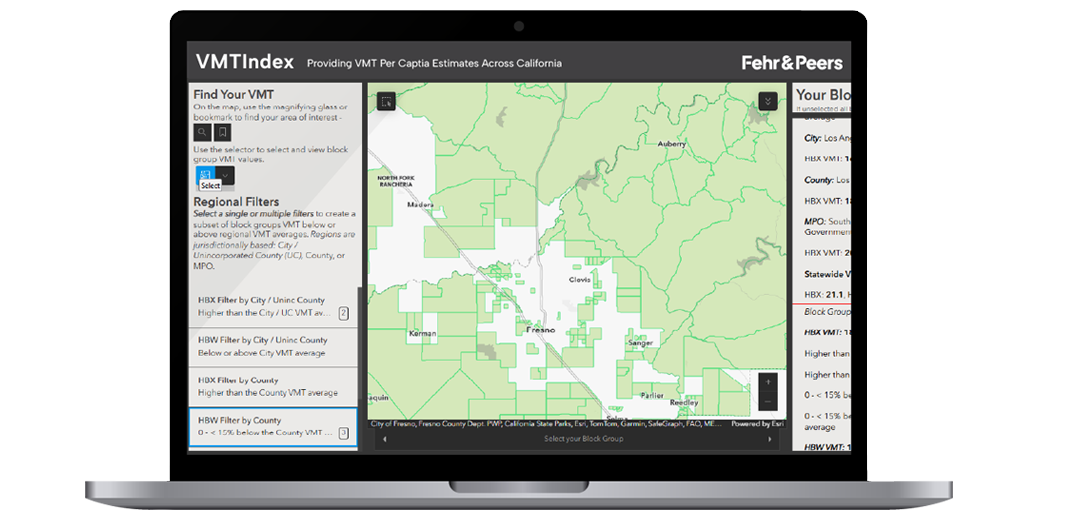
One tool estimates how far people typically drive in different areas, informing better decisions about traffic volumes, development patterns, and environmental impact.
Another assesses how easily people can reach jobs, schools, hospitals, and emergency services, helping communities identify access gaps and improve transportation equity.
Trend Analysis
Research in Action
Alongside our tools, these active research efforts focus on solving today’s challenges while preparing for those ahead. They reflect our ongoing commitment to exploring new ideas, answering emerging questions, and shaping practical, lasting solutions.

