

Mixed-use development has long been shortchanged by conventional traffic analysis. Conventional trip generation methods often treat each land use in isolation, using data collected mostly in auto-oriented suburban contexts. The result is that analyses can overstate vehicle traffic and understate how much people walk, bike, and take transit in mixed-use neighborhoods with strong connectivity, walkability, and transit service. This can lead to real downstream impacts, including oversized transportation infrastructure, higher development costs, inflated vehicle miles traveled (VMT), and skewed public perceptions.
MXD was built to fix that—and we’ve just released its most significant update since the tool was first developed over a decade ago.
The 2026 update draws on new academic research covering 622 mixed-use sites across over 30 metro areas nationwide, a substantial expansion from the original dataset of 239 sites across six metros. It also integrates trip generation rates from the ITE Trip Generation Manual, 12th Edition, released in 2025. To evaluate performance under today’s travel patterns, we collected our own independent post-COVID trip counts at more than 25 mixed-use sites across every Fehr & Peers market region. Results show that MXD performs more consistently than conventional approaches and better reflects how people are traveling in mixed-use settings.
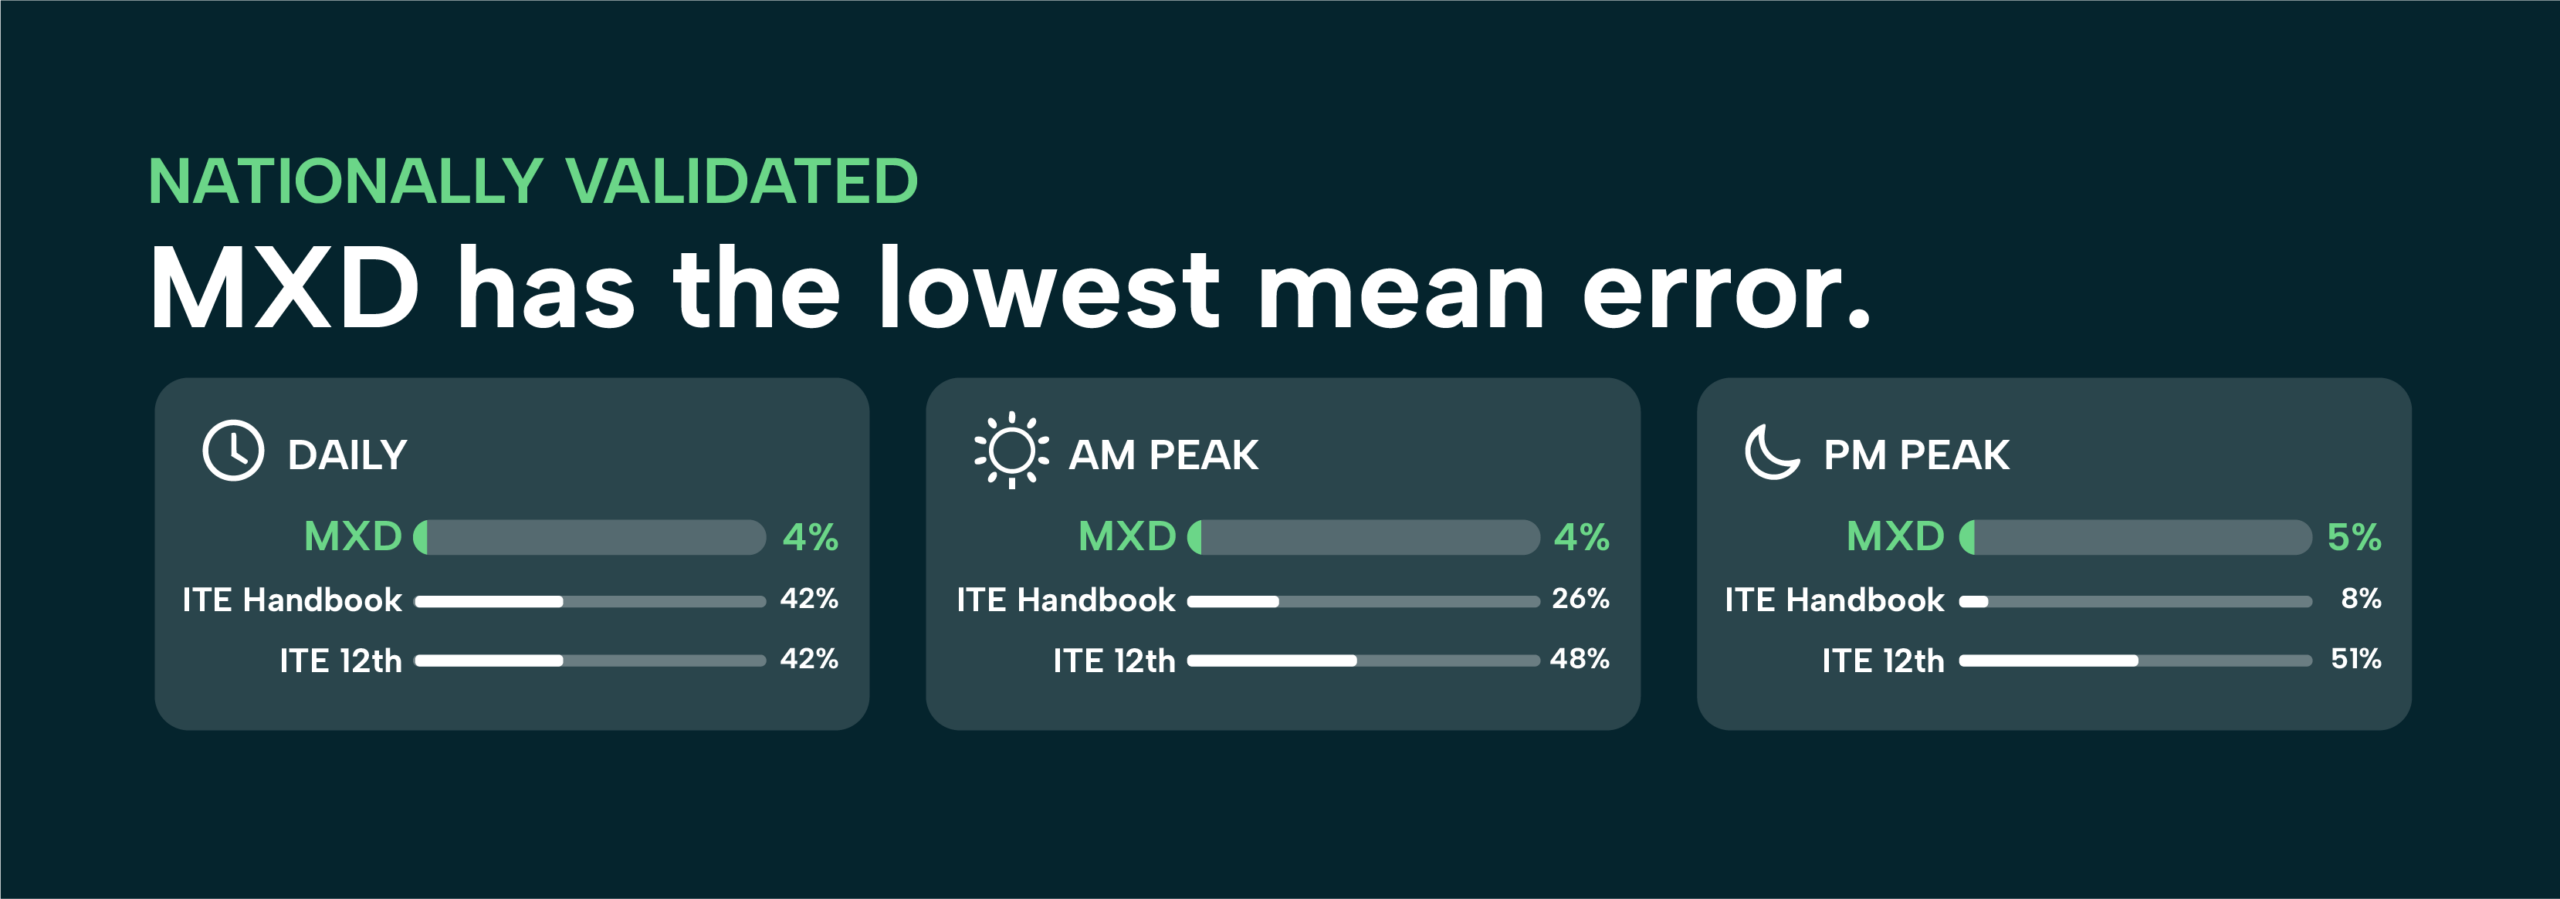
Click to expand.
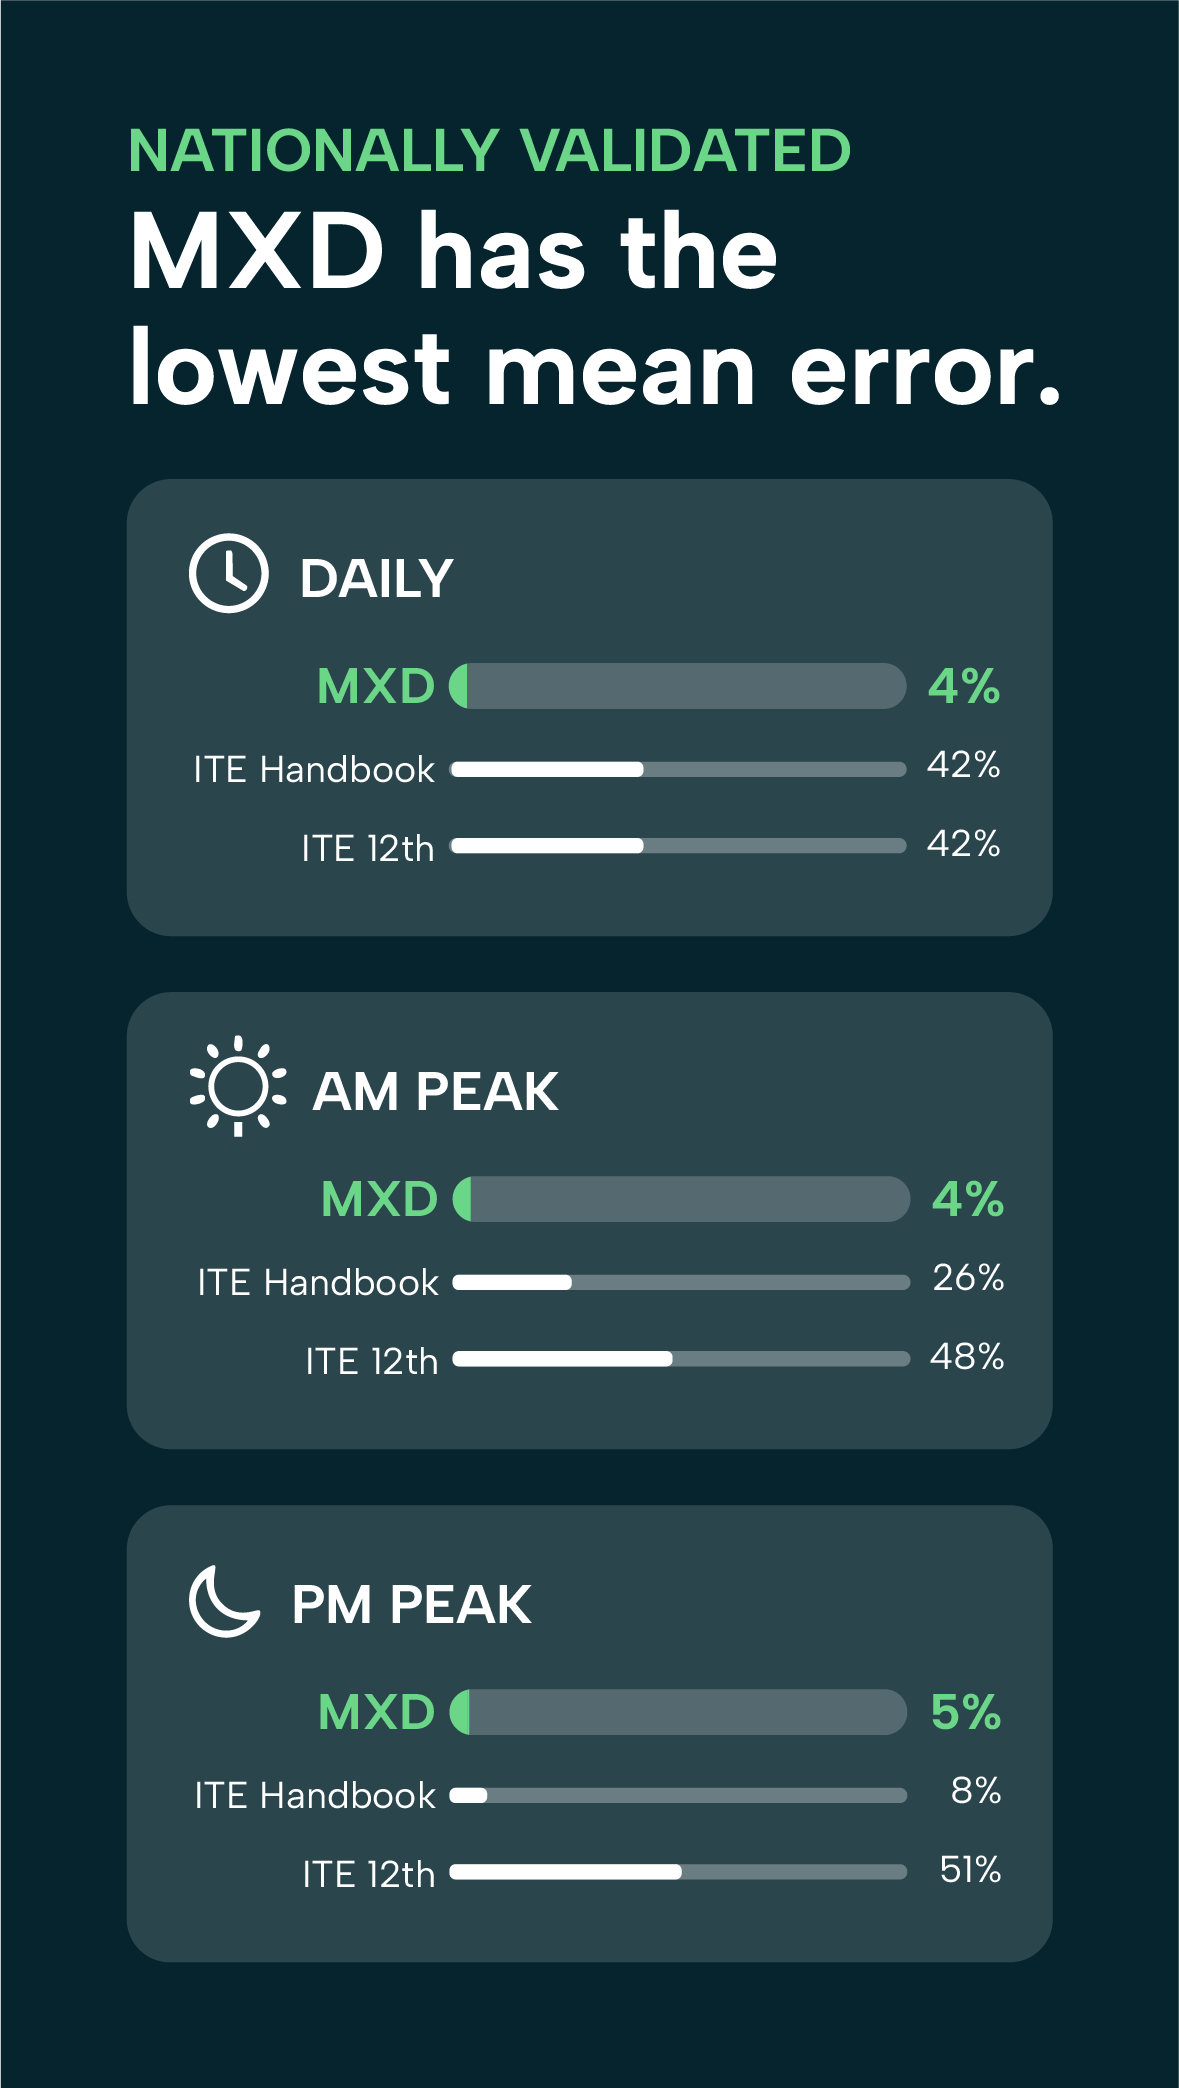
The update also reinforces something we have seen in practice for years: travel behavior varies by place and setting. The latest MXD is ready to be used anywhere in the United States, and it is designed to be customized and enhanced for communities based on local development patterns and transportation systems.
If you are working on a mixed-use project or are interested in developing a customized version of MXD for your community, we would be glad to discuss whether the updated MXD is the right fit.
share this article
Connect with Our Contributors

John Gard
Principal
AICP, PTP
Email Me

Mackenzie Watten
Travel Behavior Practice Leader
Email Me

Gillian Zhao
Planner
Email Me
Explore More
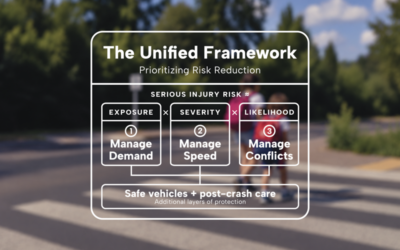
A Unified Framework for Roadway Safety
How can transportation professionals determine which safety strategies to prioritize? The Unified Framework for Safe System Implementation brings decades of safety research together to help agencies make more informed decisions. By connecting exposure, severity, and crash likelihood to different roadway contexts, the framework offers a practical way to prioritize strategies across planning, policy, design, and operations.
Meeting the Deadline Isn’t the Same as Solving the Problem
New state requirements are changing how cities approach truck route planning, but meeting a deadline doesn’t necessarily resolve conflicts between freight movement and neighborhood needs. See how Jurupa Valley used truck data, community input, and clear evaluation criteria to rethink its truck network, meet California’s AB 98 requirements, and reduce truck traffic exposure in sensitive areas.

Cathleen Sullivan Joins Fehr & Peers
Our new Principal Cathleen Sullivan brings a practical, people-centered approach to transit and multimodal planning, helping Bay Area agencies turn complex ideas into progress.