
What Hydrofoil Service Could Look Like in Washington, DC
New study finds real demand for electric hydrofoils in DC.
What Hydrofoil Service Could Look Like in Washington, DC
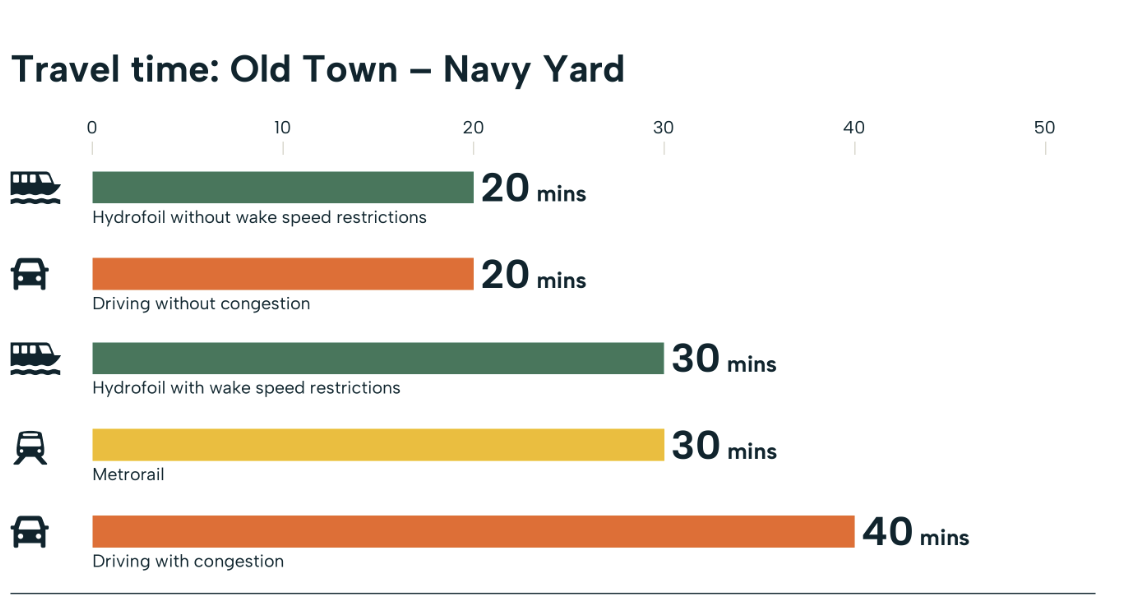
20 minutes by water. 30 by Metrorail.
Up to 40 driving in traffic.
20 minutes by water. 30 by Metrorail. Up to 40 driving in traffic.
That’s how a trip from Old Town Alexandria to Navy Yard could compare if an electric hydrofoil ferry were exempt from the 6 mph limit in no-wake zones. Under today’s limits, the same trip takes about 30 minutes, eliminating its advantage over the Metrorail.
That speed advantage is one of the possibilities explored in a new feasibility study for the DC Mobility Innovation District. The study tested how electric hydrofoils might connect waterfront destinations across DC, Virginia, and Maryland, and what a realistic pilot might look like.
Source: Unlocking the District’s Waterways: Hydrofoil Service Analysis.
Why Test Hydrofoils Here?
Riverfront neighborhoods across the DC region are growing, and residents, workers, and visitors need more efficient ways to get around. By land, places that look close on a map can mean bridge crossings and unpredictable traffic. The area’s rivers could help, but large stretches of the Potomac and Anacostia are no-wake zones.
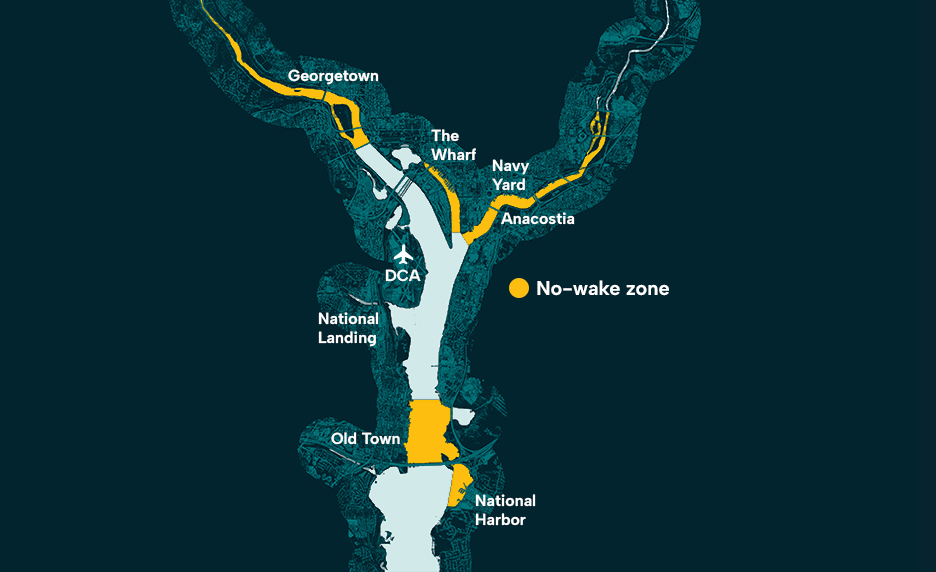
Powered boats in no-wake zones (yellow) are limited to 6 mph.
Source: Unlocking the District’s Waterways: Hydrofoil Service Analysis.
Earlier studies in the region looked at conventional ferries, which face the same wake limits. The DC Mobility Innovation District wanted to know whether a different kind of vessel could change that equation.
Enter the electric hydrofoil. It uses underwater wings to lift the hull out of the water as it picks up speed, cutting drag and leaving very little wake, which gives it a path to a potential speed exemption. For residents and visitors alike, a trip between these neighborhoods on a hydrofoil could be something people choose for the experience, not just the travel time savings.
Source: Video courtesy of Vessev.
With no local operating history to draw from, the team chose a different starting point: the trips people already make.
How Do You Test a Mode That Doesn’t Exist Here Yet?
Testing an emerging mode comes down to two questions: is there a market, and what would it take to serve it? Our proof of concept took on the first question.
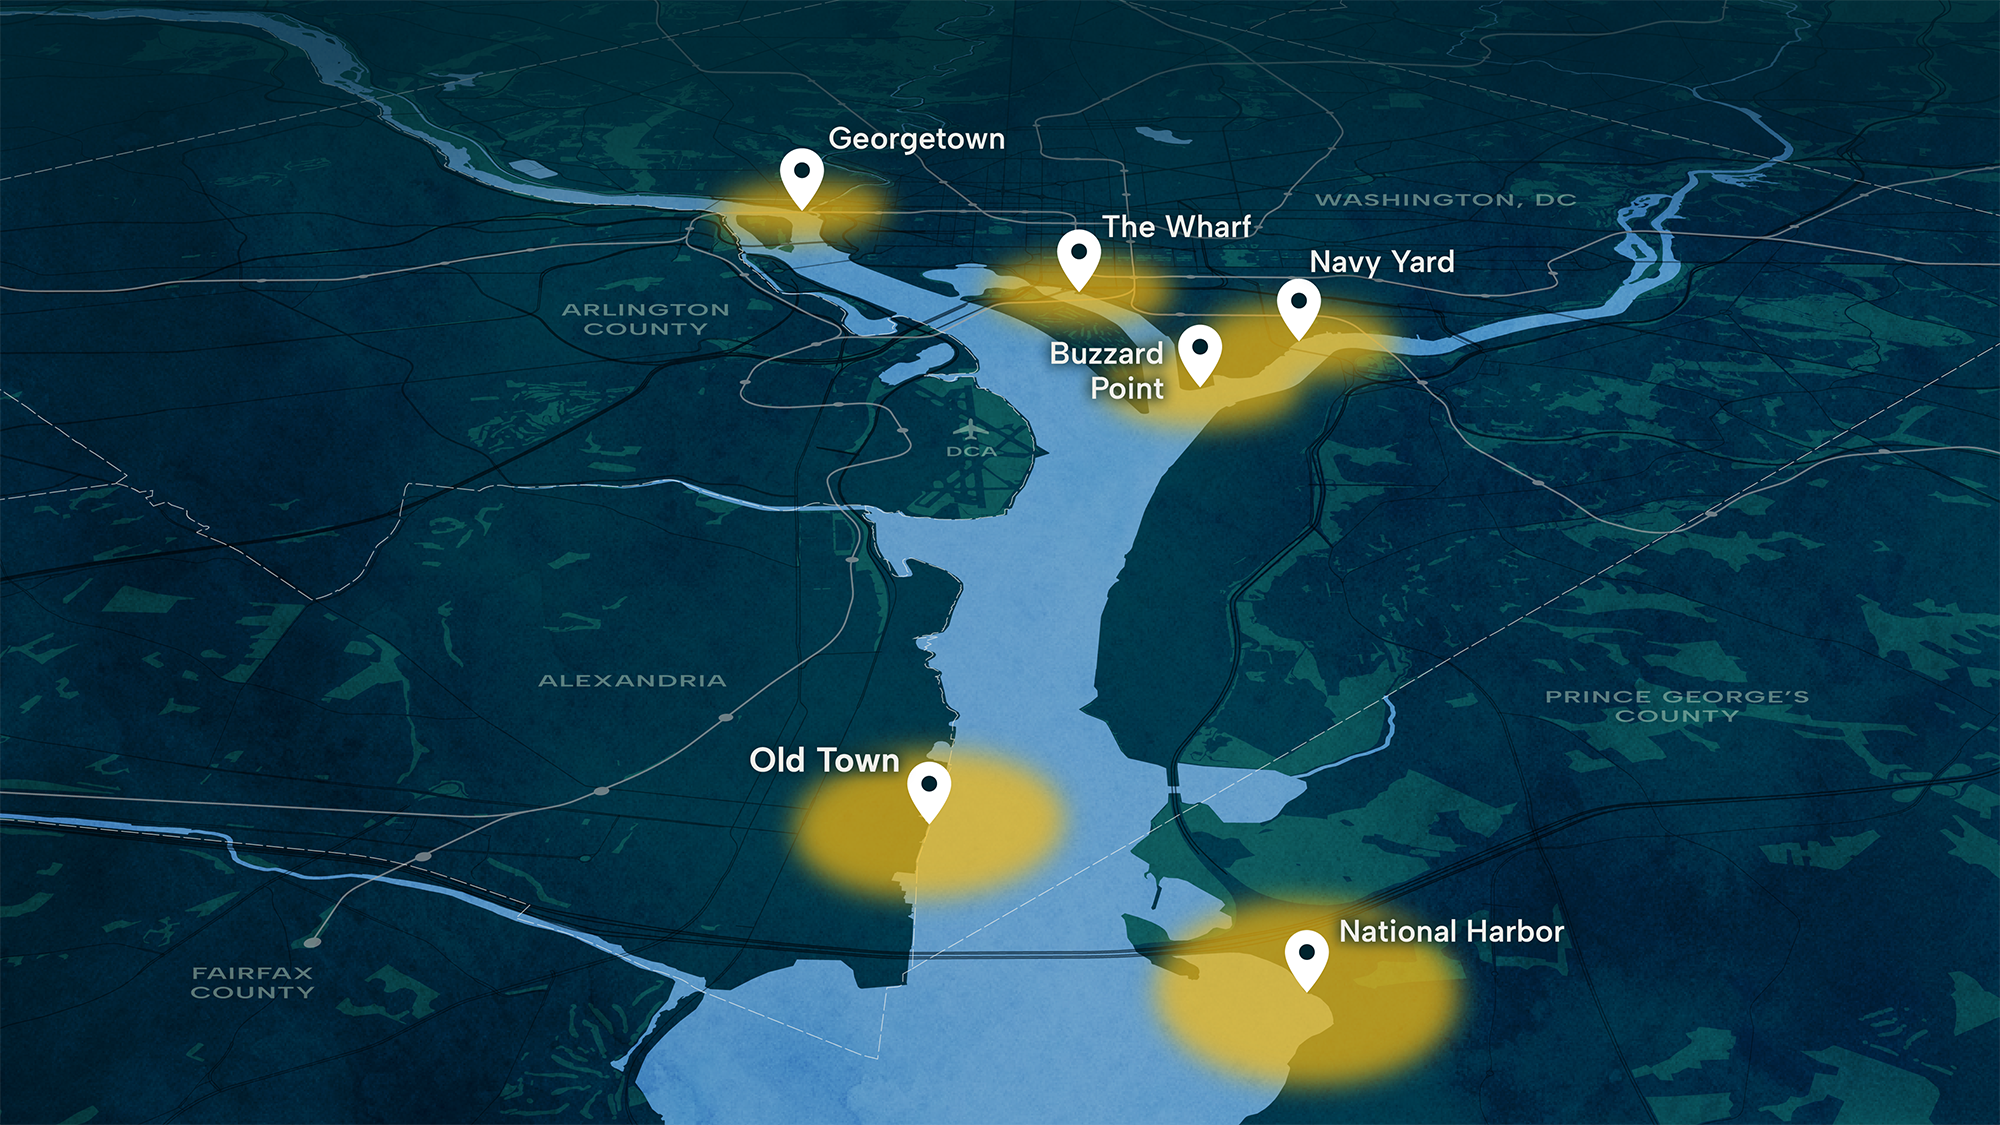
We focused on three waterfront areas: Georgetown, The Wharf, and Navy Yard/Nationals Park. The team defined a 10-minute bike ride from each landing as the potential market area, then used Replica mobility data to measure how many trips already move between them. For each of those trips, we compared today’s travel with a hydrofoil trip on time, cost, and convenience, and we accounted for people who would simply ride the hydrofoil for leisure.
The answer from our models was a clear yes, there is real demand. Because the analysis rested on current travel patterns and clear mode choice assumptions, it produced credible first insights quickly. It also raised the next questions to understand what it would take to meet that demand: which routes, at what fare, how often, and with how many boats?
The DC Mobility Innovation District partnered with us on a feasibility study to answer these questions. The team narrowed nine potential terminals to six, tested four routes, and compared service options that varied fares and frequency.
Source: Unlocking the District’s Waterways: Hydrofoil Service Analysis.
Our Findings
Four things stood out, and each shape what a pilot could look like:
- Small shares add up. About 1,250 hydrofoil trips would equal 3% of a sold-out Nationals Park, and on the strongest routes, estimated demand exceeds what the boat could carry.
- How often boats run matters more than how far they go. Adding a stop from Buzzard Point to Navy Yard takes one more boat. Running a route every 15 minutes instead of every 30 takes about four more.
- Full boats alone don’t necessarily cover costs. Even when every seat is sold, fares may fall short of paying for daily operations and upfront investments.
- The best fare depends on the route. On the longer route, boats stay full even at a higher fare, so revenue rises without losing riders. On the shorter route, the same increase pushes some riders away.
Because the right fare and frequency vary by route, the study scored each combination on ridership, fleet size, and funding needed instead of recommending a single option. Four combinations spread across three routes scored best and are recommended for further study.
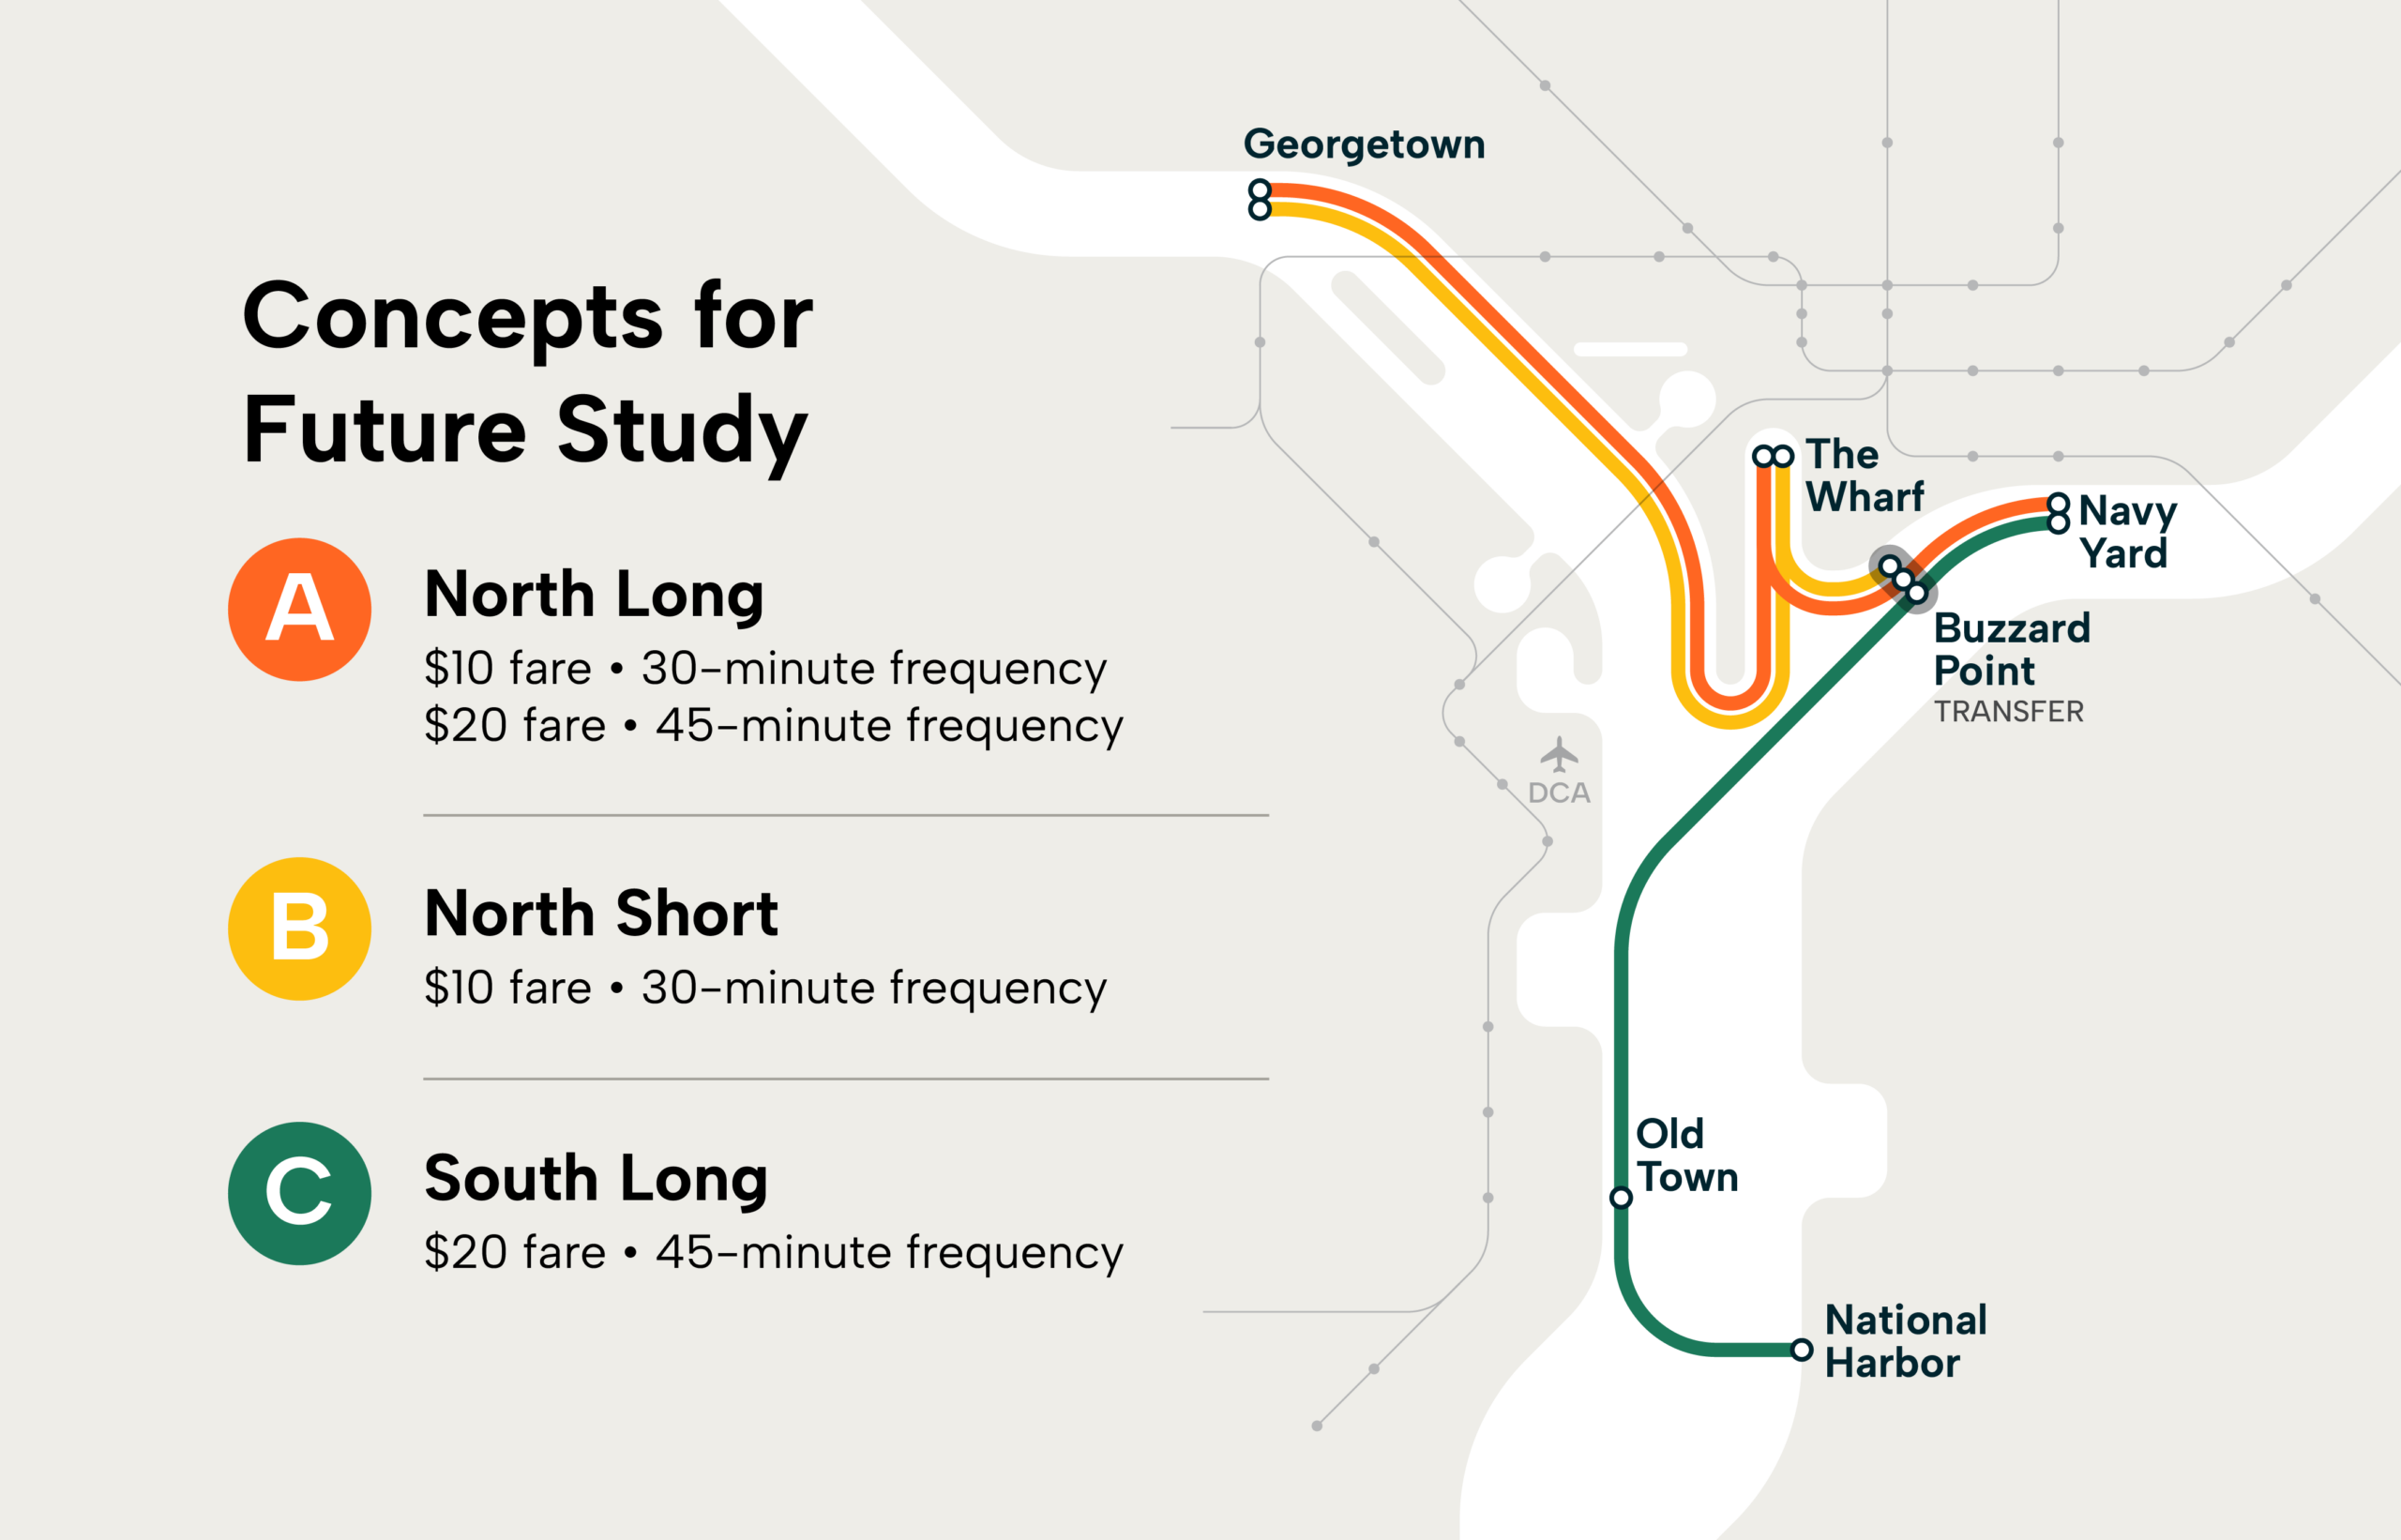
Source: Unlocking the District’s Waterways: Hydrofoil Service Analysis.
What a Pilot Could Answer
This study is a first step. Future phases would test the short list of routes in greater depth and take on what this study did not address: terminal sites and design, permitting, funding, an operating plan, and the regulatory path to a speed exemption. A pilot shows who can afford the fare, whether riders come back, how reliable trips are, and how well the service can sustain itself. If the answers hold up, the river stops being something to get around and becomes a direct route between waterfront neighborhoods, one that skips the bridges and the traffic.
A connected network could move people more efficiently, conveniently, and sustainably across the city and even over to Virginia. That would compel people to visit parts of the region they may have previously avoided, while also making the trip easier and more enjoyable for those who regularly make it.”
Emeka Monome, President and CEO, Navy Yard Business Improvement District
The same approach can work for other emerging ideas. Begin with the trips people already make, then ask whether a market exists and what it would take to serve it. Each community’s destinations and travel patterns will shape what comes next.
If you’re weighing an idea your community hasn’t tried yet, we can help evaluate its potential before significant time and resources are committed.
In the News
The study has sparked conversations about water transit in the District. Read some of the coverage so far:
- Axios: 1 big thing: New boat plan
- Bloomberg: Vessev delivers an electric hydrofoil water taxi ferry alternative
- The Washington Post: Flying ferries may be solution to D.C. traffic, official says
share this article
Connect with our Contributors

Eric Womeldorff
Principal and Transportation Economics Practice Leader
PE
Email Me

Cullen McCormick
Principal
AICP
Email Me
Explore More

The Generative AI Policy Starter Kit is Here
We helped develop a new Generative AI Policy Starter Kit for agencies, firms, and other organizations developing or refining their own AI guidance. Explore it through a Quick Bite, ITE Journal article, and online resource.

A Unified Framework for Roadway Safety
How can transportation professionals determine which safety strategies to prioritize? The Unified Framework for Safe System Implementation brings decades of safety research together to help agencies make more informed decisions. By connecting exposure, severity, and crash likelihood to different roadway contexts, the framework offers a practical way to prioritize strategies across planning, policy, design, and operations.

Meeting the Deadline Isn’t the Same as Solving the Problem
New state requirements are changing how cities approach truck route planning, but meeting a deadline doesn’t necessarily resolve conflicts between freight movement and neighborhood needs. See how Jurupa Valley used truck data, community input, and clear evaluation criteria to rethink its truck network, meet California’s AB 98 requirements, and reduce truck traffic exposure in sensitive areas.