
How Vehicle Electrification Affects the Gas Tax
How Vehicle Electrification Affects the Gas Tax
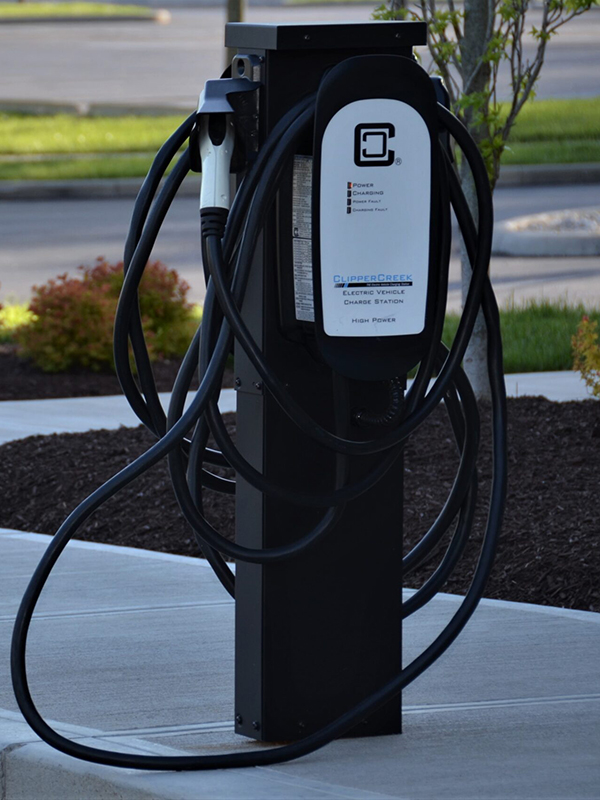
Transportation is the largest single source of US greenhouse gas emissions making up nearly 30% of the national total, and electrification is one of the most effective ways to reduce emissions.
The Federal government has set a target calling for 50% of new cars to be electric by 2030, and 100% by 2035, and many states have similar targets. Major automobile makers are on board.
Meeting the EV sales goal by 2030 would mean 14% of the fleet will be EV.
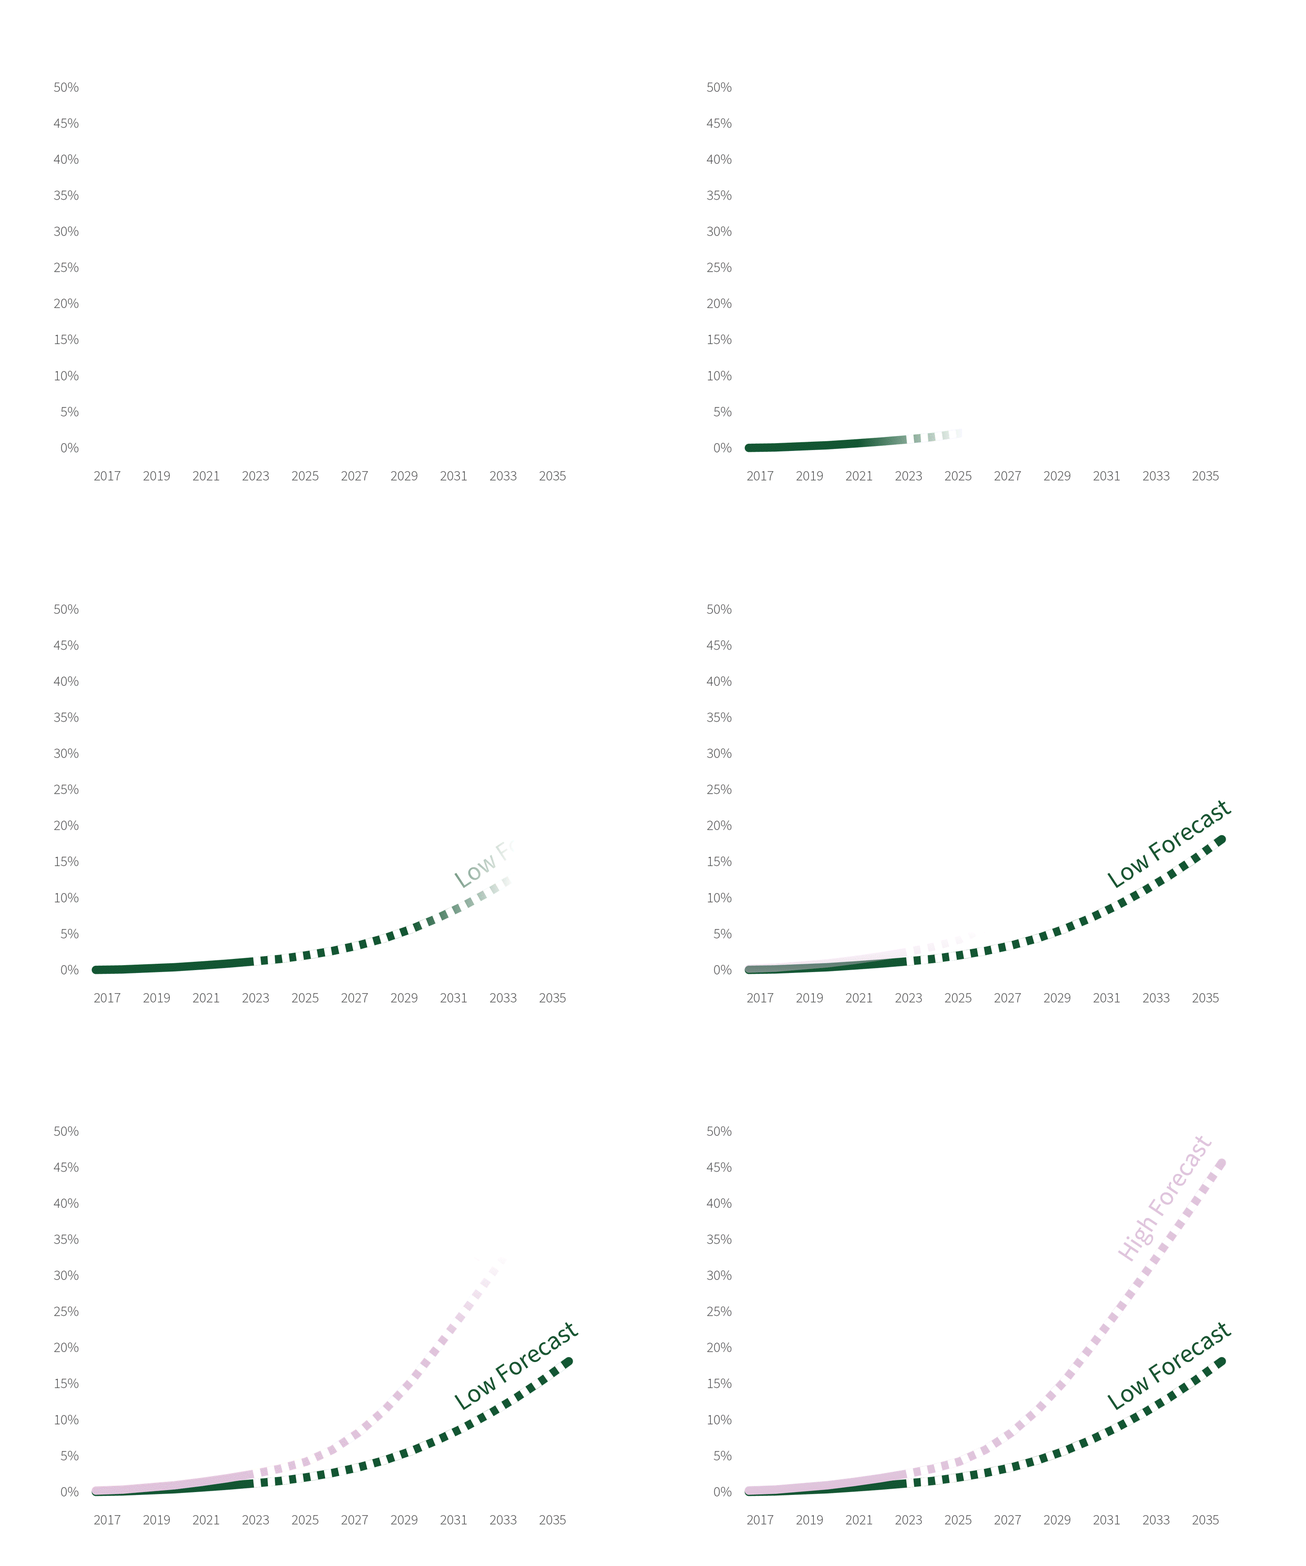
Revenue from state gas taxes average between 40% and 50% of state transportation funds.
Federal gas taxes in most states represent the next highest share and are also threatened by EV growth and improved fuel economy.
Other sources include vehicle sales taxes and registration fees and transportation infrastructure bonds.
State gas tax rates vary from 9 cents a gallon in Alaska to 57 cents in California, with most states charging 20 to 35 cents a gallon.
States also depend on the Federal gas tax, which has not increased since 1993, while infrastructure costs have increased substantially.
Thus, the purchasing power of those tax dollars is half of what it was in 1993. In 2022, inflation has reared its head in ways not seen in decades.

Improved fuel economy for conventional vehicles will further erode gas tax revenues about 9% by 2035 based on recent trends.
The Biden administration has ordered an even steeper rate of improvement, raising CAFÉ standards to 49 mpg by 2026.
Even if we were to return to historical rates of inflation, purchasing power of tax revenues will decline by 25% by 2035.

How do we assess the implications and potential solutions when every state seemingly has a different funding approach?
Start by modeling projections to perform revenue and expenditure projections based on state-specific gas tax rates and changes in vehicle miles traveled.
Evaluate different scenarios for addressing funding shortages based on different fleet adoption rates and mileage and tax rates.
Account for different numbers of vehicle miles travelled and resulting infrastructure impacts by EVs.
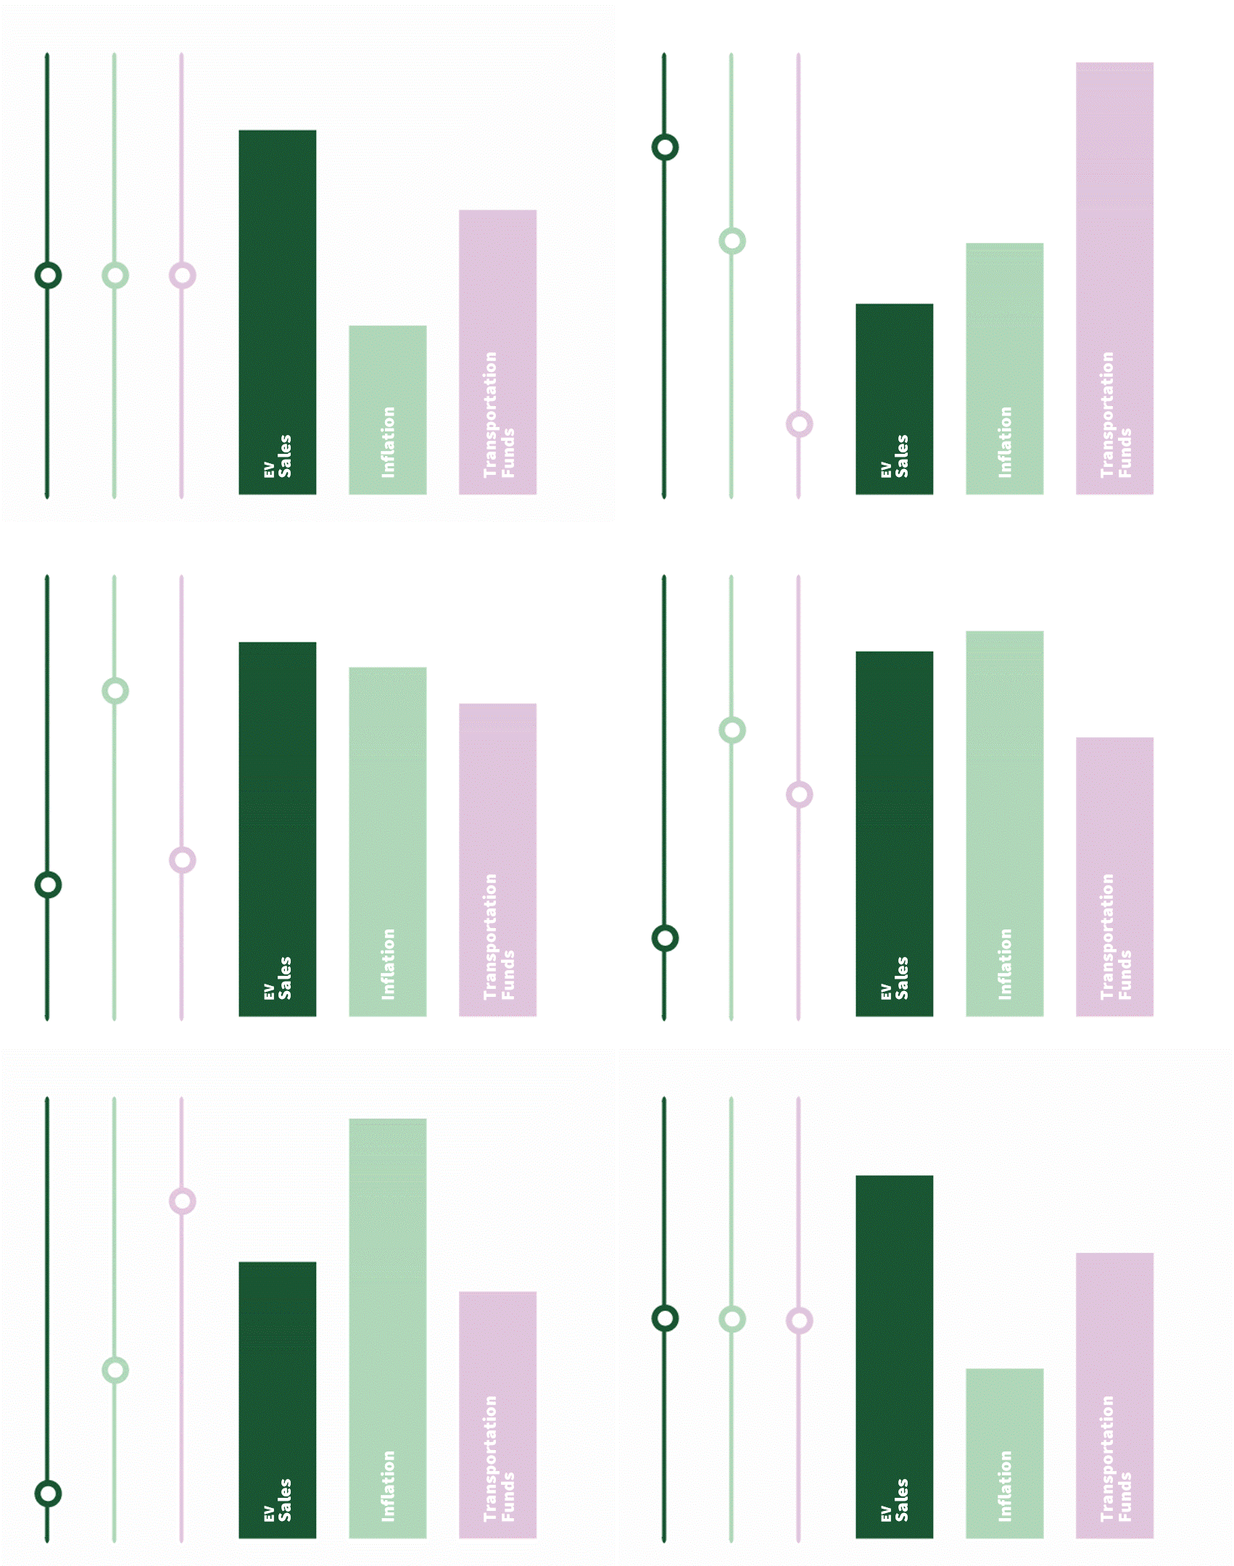
If EVs increase in line with forecasts, gas tax revenues could reduce by 21% to 30% by 2035.
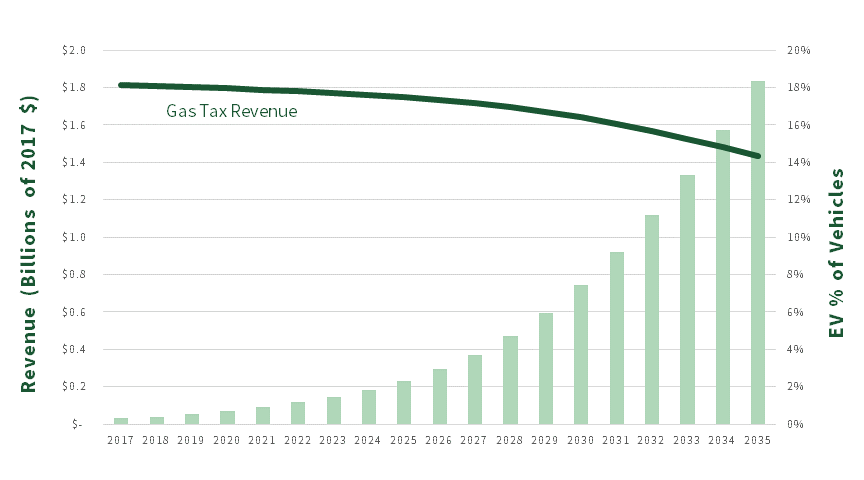
Funding levels available for transportation improvements in 2035 could effectively be reduced to 48% to 54% of current levels.
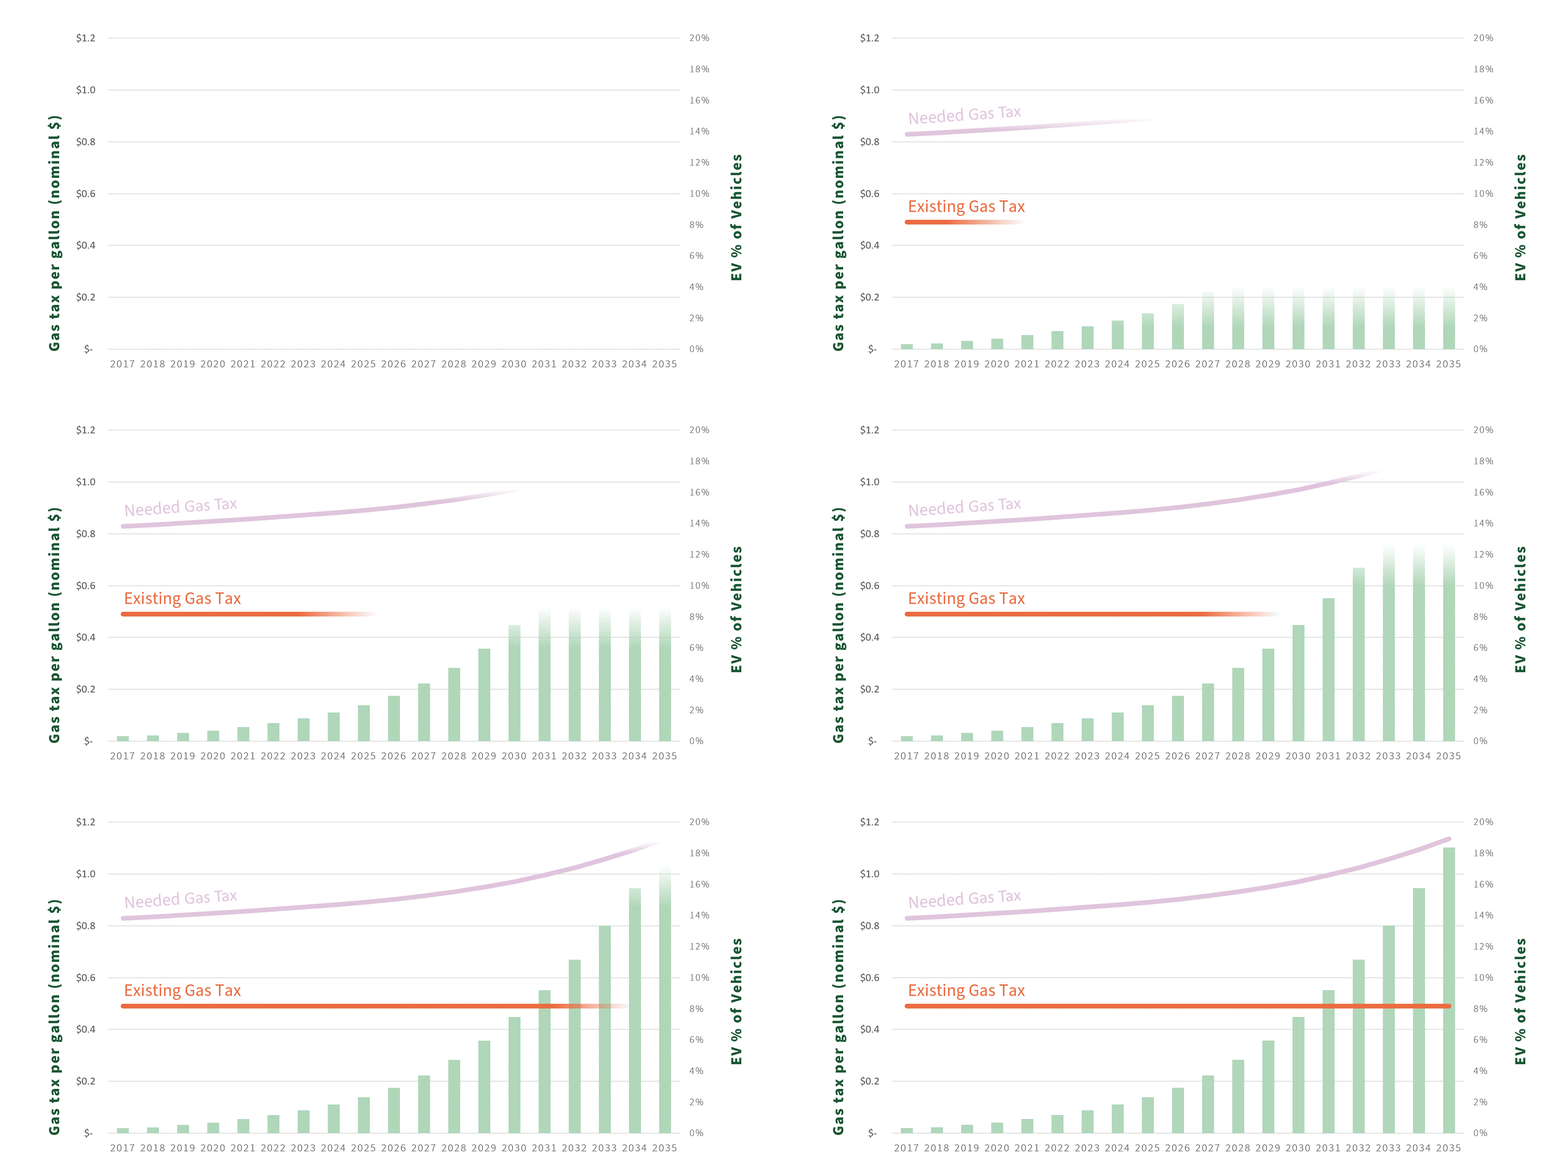
What can be done?
Evaluate the cost effectiveness of potential solutions to offset revenue loss, including:
| Index state and federal gas taxes to inflation | ||
|---|---|---|
| Index gas tax inversely to decline in fuel consumption per mile | ||
| Replace state gas tax with per-mile taxes | ||
| Implement or increase tolls | ||
| Apply for Federal waiver to allow interstate tolling | ||
| Align taxes and fees on EVs to offset their gas tax savings | ||
| Increase registration fees and sales taxes | ||
| Carbon tax surcharge on gasoline excise taxes | ||
| Congestion pricing | ||
| Offset EV purchase subsidy with per mile tax on EV use | ||
| Greater reliance on infrastructure bonds |
| Tax reduction or refunds are under serious consideration at the federal levels and in many states to offset the 2022 inflationary increase in gas prices | ||
|---|---|---|
| Transit recovery is in jeopardy: | ||
| 1) Covid has severely impacted the transit revenues and the funding of system and service improvements | ||
| 2) Federal and, in most states, state gas tax revenues are partially used to support transit | ||
| The Build Back Better infrastructure funding program will provide a substantial boost in transportation funding, but is not a sustainable resource to address on-going needs |
What types of expertise does Fehr & Peers offer and how can we help you?
Interested in talking more about this topic?
share this article
Explore More
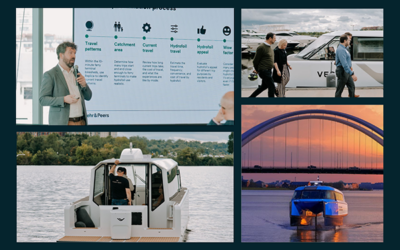
What Hydrofoil Service Could Look Like in Washington, DC
Could electric hydrofoils offer a faster way to travel between waterfront neighborhoods in Washington, DC? Our feasibility study found potential ridership demand and tested how routes, fares, and service frequency could shape a future pilot. The approach also offers a way for other communities to evaluate emerging transportation ideas before committing significant resources.
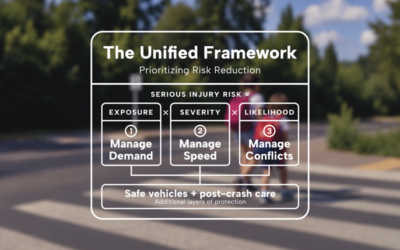
A Unified Framework for Roadway Safety
How can transportation professionals determine which safety strategies to prioritize? The Unified Framework for Safe System Implementation brings decades of safety research together to help agencies make more informed decisions. By connecting exposure, severity, and crash likelihood to different roadway contexts, the framework offers a practical way to prioritize strategies across planning, policy, design, and operations.

Meeting the Deadline Isn’t the Same as Solving the Problem
New state requirements are changing how cities approach truck route planning, but meeting a deadline doesn’t necessarily resolve conflicts between freight movement and neighborhood needs. See how Jurupa Valley used truck data, community input, and clear evaluation criteria to rethink its truck network, meet California’s AB 98 requirements, and reduce truck traffic exposure in sensitive areas.