

Effective collaboration with our partners is at the core of the Fehr & Peers philosophy that transportation solutions are best developed together. We are excited to share the Cincinnati Strategic Transit Study, which is the product of the Cincinnati Mobility Lab, an unprecedented partnership between municipal and regional agency partners and the transportation network company Uber. In our study, we consider the recent emergence of Uber and Lyft against the backdrop of over 50 years of steadily declining transit ridership in Cincinnati. We then provide recommendations for how on-demand and fixed route transit can best fit together to deliver a sustainable and prosperous future for the people of the Cincinnati region.

- Make it faster: Reinforce backbone service through service restructuring and bus-supportive infrastructure.
- Make it easier: Integrate fares and bundle mobility options to produce a seamless alternative to driving.
- Make it smarter: Make targeted investments in on-demand services in areas identified as being most responsive to this type of service.

What markets do auto, transit, and Uber serve?
Click on an image to see a series of travel flow maps that help show differences in travel patterns between auto, transit, and Uber, as well as comparative data on ridership between modes.

Auto
The thickness of the green lines shows the number of auto trips between sub-regional zones, and the size of the gray circles show number of trips within each zone. The CBD is not prominent. This demonstrates an archetypal auto trip pattern – mapping closely to the multi-polar nature of the regional job market, characterized by lots of travel within and between suburbs.

Transit
Blue lines show transit travel. We can see transit ridership is mostly in core corridors connecting the CBD, adjacent areas, and the west side (which is a predominately low-income area). These are the backbones where transit captures over 10% of the overall travel market. The patterns reflect the predominately hub and spoke nature of the current bus service.

Uber
Uber travel is shown in orange. Uber travel is fairly well-dispersed, but with clear concentrations around the east side (which is a predominately high-income area), the regional airport to the southwest, as well as a lot of general crosstown travel. Unlike auto travel, Uber and transit each present very location-specific concentrations.

Ridership Decline
Transit ridership in Cincinnati has been in steady decline for at least the last 50 years. Ridership per capita dropped from 35 in 1963 to 11 in 2017, a loss rate of over 1.2% a year. In this context, any loss attributable to TNCs appears to be minor.

Daily Trips
Between 2014 and 2018, Uber use in the Cincinnati region has grown from 0 to 10,000 trips per day, while the local and regional transit systems have seen decreases totaling 8,000. We also estimate that up to 1,300 of these 10,000 Uber trips may have switched from transit, according to an Uber rider survey conducted for the study.

Time of Week Variation
Transit ridership heavily outweighs Uber during the weekday daytime. For example, transit trips outnumber Uber 6:1 in the weekday PM peak period. However, the gap narrows during evening and weekends to 2:1 for weekday evenings and 1.25:1 on the weekend.

Reasons Cited for Shift to Uber
As part of the Uber rider survey, we asked why people shifted to Uber from another mode. Respondents could select more than one reason. Ease of use, cost-effectiveness, and lower wait and travel time were frequently cited reasons, particularly for those shifting from transit.
Explore the Study
We invite you to explore the study to learn more.
Chris Pangilinan, Head of Global Policy for Public Transportation Uber
Do you have questions or insights about the Cincinnati Strategic Transit Study or how on-demand transit can reinforce fixed route transit?
share this article
Explore More
MXD Gets Its Biggest Update Yet
Our Mixed-Use Development (MXD) tool just got its biggest update in more than a decade. Built on expanded national research and updated ITE trip rates, the 2026 release delivers more accurate, context-sensitive trip estimates for mixed-use places, including validation using post-COVID field counts.
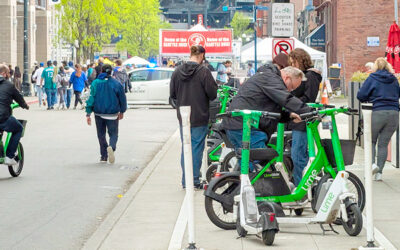
A Design Win for Seattle Sidewalks
Micromobility is growing, but when scooters and bikes have nowhere obvious to park, sidewalks suffer. Seattle tackled this with quick-build corrals, using simple outlines to guide parking right away, then upgrading to durable markings and in-street designs. See how we helped screen sites, refine locations in the field, and scale for daily use and major events.

Jason Xu Joins Fehr & Peers as Principal
Meet Jason Xu and his approach to improving transportation operations, signal systems, and corridor coordination.