
Pedestrian Paradise, or Is It?

Pedestrian Paradise, or Is It?
Location. Location. Location. Tools like Walk Score® are commonly used to identify high quality pedestrian neighborhoods and cities. The higher the walkability score, the more pedestrian-friendly it claims to be, with lower scores indicating greater car dependency. A recent article by TheTravel.com ranks top California cities by their walkability scores, but do these ratings paint a complete travel picture?
Enter the metric, Vehicle Miles Traveled (VMT.) While Walk Score® describes the pedestrian environment, VMT measures how much people are driving. Walkability is great for indicating easy access to amenities and daily activities on foot, however, relying solely on these scores can overlook commute distances and quality of the transportation infrastructure. Factoring in the amount of driving, or VMT generated, can reveal how car dependent an area is on driving. Despite its traditional use by transportation experts analyzing environmental impacts, VMT is emerging as a tool with much broader applications and growing public benefit. Realtors, homebuyers, renters, tourists, and potential business owners can learn how much driving occurs within cities, communities, or more specific locations.

So Does A Walkable City Mean People Are Driving Less?
It’s easy for us to assume that a city with a high Walk Score®, denoting pedestrian-friendliness, might automatically mean it has a low VMT score, meaning people are less dependent on driving. Not necessarily. And pause to consider why that could be important. If a location had a high Walk Score® and high VMT, that would mean high walkability and people driving a lot. More people driving means more traffic congestion, road noise, parking issues, and an increased potential for collisions. Ultimately, that can begin impacting a community’s quality of life. So, how can we assess a community’s VMT score?
More people driving means more traffic congestion, road noise, parking issues, and an increased potential for collisions. These can impact pedestrian safety which can affect location desirability and quality of life.
Understanding Driving in Your Community
We’ve developed VMTIndex, a specialized tool crafted in response to shifting local, state, and national interests about how driving affects our communities and regions. VMTIndex uses census block groups to map two important VMT metrics: home-based VMT per resident and home-based work VMT per employee. For this story, we used the home-based VMT per resident to measure and rank the VMT being generated by residents in California cities. For the Top 10 Walk Score® cities noted in the TheTravel.com article, we compared the results.
We’ve developed VMTIndex, a specialized tool crafted in response to shifting local, state, and national interests about how driving affects our communities and regions.

Finally, take a look at an unsuspecting contender based on its strong Walk Score® and impressively low driving levels: the waterfront resort community of Avalon on Santa Catalina Island. Trending from the results, dense walkable cities with multiple travel options have low VMT rates as expected. Isolated communities also exhibit lower VMT levels, but this can occur due to demographic and socioeconomic factors unrelated to their built environments.
Want to Explore on Your Own?
Our VMTIndex tool is open source for anyone to use and helps navigate the intricacies of CEQA. To learn more, access our tool here. If you’re interested in exploring the national data or a custom version for your state, feel free to contact us, we have plenty of data to address your goals.
Keep joining us in this series to continue learning more about other valuable and perhaps unexpected VMT applications and how you can apply this data to your projects.
² VMT is based on home-based VMT per capita
share this article
Contributors

Ron Milam
Forecasting Practice Leader
Email Me

Griffin Kantz
Engineer/Planner
Email Me

Victoria Hatch
Senior Copywriter
Email Me
Explore More
MXD Gets Its Biggest Update Yet
Our Mixed-Use Development (MXD) tool just got its biggest update in more than a decade. Built on expanded national research and updated ITE trip rates, the 2026 release delivers more accurate, context-sensitive trip estimates for mixed-use places, including validation using post-COVID field counts.
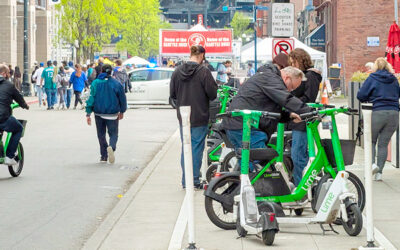
A Design Win for Seattle Sidewalks
Micromobility is growing, but when scooters and bikes have nowhere obvious to park, sidewalks suffer. Seattle tackled this with quick-build corrals, using simple outlines to guide parking right away, then upgrading to durable markings and in-street designs. See how we helped screen sites, refine locations in the field, and scale for daily use and major events.

Jason Xu Joins Fehr & Peers as Principal
Meet Jason Xu and his approach to improving transportation operations, signal systems, and corridor coordination.