

Reducing vehicle miles traveled (VMT) is a popular topic of discussion for communities across the country. In many jurisdictions, VMT reduction stems from planning and environmental goals related to reducing greenhouse gases (GHG), encouraging infill development, and improving access for active transportation and transit.
Certain states, such as California, have already shifted to VMT as the primary metric of transportation impact rather than the traditional metric of level of service (LOS). One planning strategy often considered for impacting VMT is free transit, while another that is growing in popularity is a mileage-based VMT tax.
Reducing overall VMT results in lower transportation emissions and improved air quality, pushing communities closer to meeting environmental goals; however, it conflicts with how federal and state transportation agencies obtain their funding. They depend upon the gas tax or VMT generation for their revenue. With fuel-efficient and electric vehicles on the rise and transit ridership in a steady decline over the last decade in the US, it begs the questions: What impact could a VMT tax have on vehicle travel? Are there potential equity implications from this approach compared to a free transit policy?

Study: To help answer these questions, we used a SACSIM19 activity-based travel demand model from the Sacramento Council of Government (SACOG) region in California to explore the implementation of VMT tax. Specifically, we compared the potential effectiveness of a VMT tax policy to a free transit fare policy and looked at how the individual policies affect environmental justice (EJ) communities.
Findings: A VMT tax policy would bring revenue and reduce VMT percentage but may make travel unaffordable for low-income households. On the other hand, the free transit scenario would improve transit ridership and reduce individual cost burden, especially in the EJ communities. However, this scenario would be costly for transit agencies to implement. A combination of the two scenarios is likely to result in a more equitable VMT reduction strategy to increase revenue and reduce emissions.
Overall Impact to Daily Regional Travel
| Community Type | Vehicle Miles Traveled | Vehicle Hours of Delay | Vehicle Hours Traveled | Transit Ridership | ||||
| Free Transit | VMT Tax | Free Transit | VMT Tax | Free Transit | VMT Tax | Free Transit | VMT Tax | |
| All | -0.2% | -3.6% | -0.4% | -4.1% | -1.0% | -10.2% | 30.6% | 5.2% |
Community Impact
| Community Type | Household Generated VMT | Transit Mode Share | Impact to Travel Costs for All Trips | Impact to Travel Costs for Work Trips | ||||
| Free Transit | VMT Tax | Free Transit | VMT Tax | Free Transit | VMT Tax | Free Transit | VMT Tax | |
| EJ | -0.5% | -4.1% | 23.3% | 3.7% | -4.3% | 35.2% | -5.9% | 38.6% |
| Non-EJ | -0.3% | -4.3% | 26.8% | 4.2% | -1.7% | 35.2% | -2.8% | 38.7% |
Methodology and SACSIM19 Data
This study is based on a 6 cents per mile VMT tax. The current gas tax equates to roughly 3 cents per mile in California; doubling to 6 cents is anticipated to cause a reduction in VMT by discouraging driving. As part of the modeling, the daily VMT, transit ridership, and cost effects were isolated for EJ and non-EJ communities as defined by SACOG.
The test scenarios were summarized to get the following nine metrics that compare overall impact and equity impacts of the two policies.
Aggregated Regionwide Metrics
These are summarized to analyze and compare overall impacts of two study scenarios:
- Total regional VMT
- Total regional Vehicle Hours Traveled
- Total regional Vehicle Hours of Delay
- Transit Ridership
Metrics by EJ and Non-EJ Communities
These are summarized to isolate and compare equity impacts of two study scenarios for the two communities. These are all calculated using the trip table output of the SACSIM19 model:
- Household VMT
- Transit Mode Share
- Travel cost for all trip purposes
- Travel cost for work trips
Community Breakdown
| Community Type | Household Generated VMT | Transit Mode Share | Impact to Travel Costs for All Trips | Impact to Travel Costs for Work Trips | |
| EJ | 712,077 | 1,893,130 | 2.65 | 65,118 | |
| Non-EJ | High Minority | 64,598 | 194,844 | 3.02 | 60,712 |
| Low Income | 140,682 | 329,934 | 2.35 | 40,754 | |
| Other Vulnerability | 4,287 | 10,070 | 2.35 | 51,179 | |
| CalEnvironScreen3.0 | 11,460 | 27,566 | 2.41 | 42,263 | |
| 2+ Categories | 203,495 | 541,288 | 2.66 | 40,716 |
What questions are you facing? Let’s explore them together.
share this article
Explore More
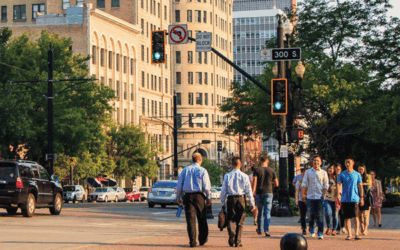
Prioritizing People in Multimodal Design
Discover how one city is redesigning their streets to make experiencing destinations safer and more enjoyable, and how their process and design typology can be adapted to streets across the US.
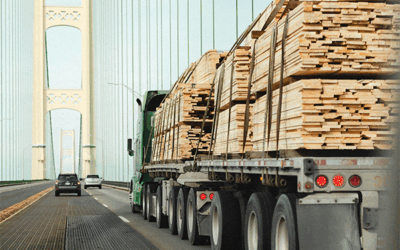
Achieving Freight Greenhouse Gas Goals
Available guidance for agencies to gather an accurate picture of current freight activity is limited. Check out how this community defined their baseline in four steps to be able to evaluate freight zero emission zones as a strategy for meeting new climate and environmental policy goals.
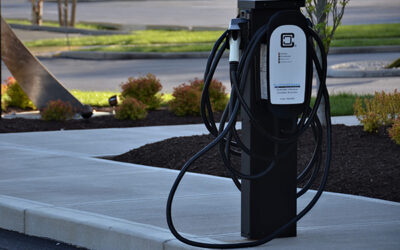
How Vehicle Electrification Affects the Gas Tax
With electric vehicle sales increasing, how durable is our ability to build and maintain highway and transit infrastructure through current gas tax measures? Explore the full scope of promoting a cleaner and more resilient transportation system.