
Visualizing VMT Per Capita
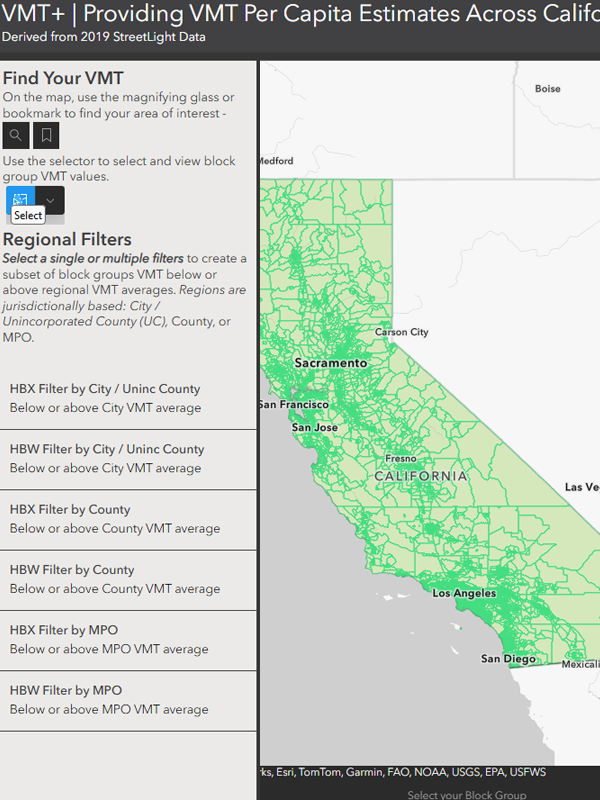
Visualizing VMT Per Capita
Vehicle Miles Traveled (VMT) is an essential metric for measuring the impacts of land use and transportation network decisions. While the metric can be expressed in many forms, VMT per capita is commonly needed for various California transportation planning applications including:
- CEQA transportation impacts
- Competitive grant applications
- Greenhouse gas (GHG) and air pollutant emissions modeling
- Land use scenario analysis for general and specific plans
Until now, the applications above required local or regional travel demand models to estimate current conditions and those models did not allow comparisons across regions. To better understand VMT per capita and how it varies across California, we’re introducing a first-of-its-kind VMT visualizer, VMTIndex, that can equip planners with greater insight into VMT at the state, regional, and local levels. Developed with StreetLight data, VMTIndex offers VMT per capita estimates with the option to filter down to the Census Block Group (CBG) level to understand a specific area’s VMT generation rates.
The idea for this tool came years ago from conversations with Caltrans and the Governor’s Office of Planning & Research (OPR), about the need for metrics to implement SB 743 in California. This data is now available statewide for public use and was designed as a template for visualizations in other states. A new 2022 data set will also be available soon through our consulting services.
We invite you to explore the new VMTIndex visualizer and surrounding resources. Please note, these VMT estimates are new and have not been fully validated or peer reviewed. We welcome all suggestions for improving the data or tool. If you’d like current baseline estimates or wish to talk about the ability to track VMT performance over time, contact us.
share this article
Contributors

John Gard
Principle
Email Me

Mike Wallace
Email Me

Ron Milam
Forecasting Practice Leader
Email Me

Patrick McDonough
Database Engineer
Email Me
Explore More

Get a First Look at the Generative AI Policy Starter Kit
We helped develop a new Generative AI Policy Starter Kit through ITE. Explore the Quick Bite and ITE Journal article now, and stay tuned for the full kit.
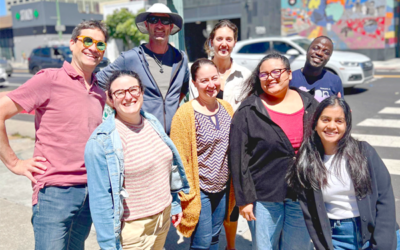
Intern Perspectives: A Summer in Transportation
What does a transportation internship actually look like? This summer, 25 interns across 14 of our offices gained hands-on experience with fieldwork, street design, GIS, data analysis, visual communication, client work, and community engagement. See what they learned, what surprised them, and how the experience shaped the way they think about careers in transportation.
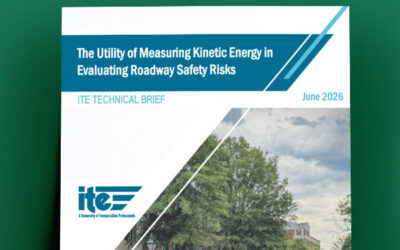
Looking at Street Safety Through the Lens of Kinetic Energy
This ITE Technical brief explores how kinetic energy can add another dimension to roadway safety analysis, helping practitioners consider where conditions for serious harm may exist even before severe crash patterns emerge.