

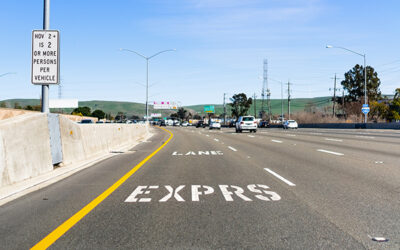
Estimating vehicle trips at mixed-use developments can be challenging. Most traditional trip generation rates are based on single-use suburban sites and don’t account for how people actually travel in mixed-use developments (MXD), where trips can happen internally or by walking, biking, or transit.
This white paper presents how we recalibrated and validated our MXD tool to reflect 2019 travel conditions. The update incorporates changes in travel behavior over the past decade, including the rise of ride-hailing services, e-commerce, telecommuting, and micromobility.
Using observed traffic data from mixed-use sites across the US, the updated MXD model produces more accurate estimates of daily and peak-hour vehicle trips, helping planners and communities better evaluate the transportation impacts of mixed-use developments.
Ready to read the white paper? Click the button below to access.
share this article
Contributor

John Gard
Principal
Email Me
Explore More
A New Travel Efficiency Metric, Seat Utilization: Part 2 of 3
Transportation analysis practice would benefit from new metrics measuring efficiency and space utilization. Learn about the travel efficiency metric proposed by Uber.
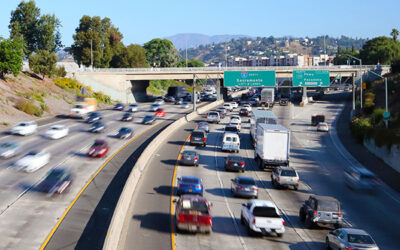
A New Focus on Climate & Congestion, Seat Utilization: Part 1 of 3
Demand management includes a range of strategies from how roadways are operated to behavioral incentives that influence when and how much people travel by mode.
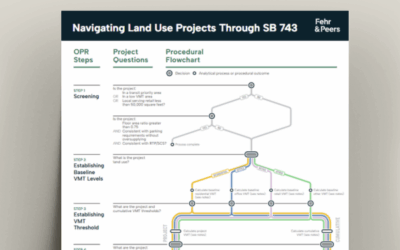
Navigating Land Use Projects Through SB 743
This document offers a step-by-step framework for evaluating and mitigating VMT impacts of land use projects under California’s SB 743 guidelines.