

Estimating vehicle trips at mixed-use developments can be challenging. Most traditional trip generation rates are based on single-use suburban sites and don’t account for how people actually travel in mixed-use developments (MXD), where trips can happen internally or by walking, biking, or transit.
This white paper presents how we recalibrated and validated our MXD tool to reflect 2019 travel conditions. The update incorporates changes in travel behavior over the past decade, including the rise of ride-hailing services, e-commerce, telecommuting, and micromobility.
Using observed traffic data from mixed-use sites across the US, the updated MXD model produces more accurate estimates of daily and peak-hour vehicle trips, helping planners and communities better evaluate the transportation impacts of mixed-use developments.
Ready to read the white paper? Click the button below to access.
share this article
Contributor

John Gard
Principal
Email Me
Explore More
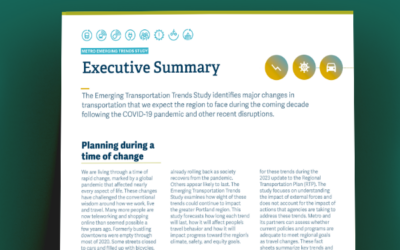
Metro Emerging Trends Study
Utilizing the TrendLab+ scenario planning tool, the study assesses the short- and long-term impacts of these trends on vehicle miles traveled (VMT), transit usage, safety, and equity within the Portland region, providing insights to inform the 2023 Regional Transportation Plan update.

Applications of Big Data in Safety Analysis
Check out the new ITE brief written for transportation professionals to determine the most effective data sources to apply when scoping, implementing, and evaluating safety projects.
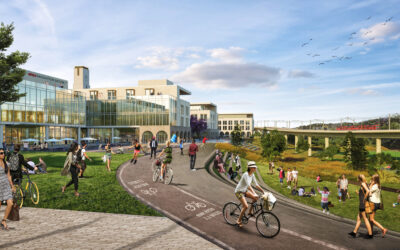
Reclaiming a Concrete Desert
Learn how the once-touted largest single surface parking lot, now known as SDSU Mission Valley, is being reimagined. The new design is all about reducing the need for cars, improving mobility, and creating a vibrant, walkable, and bikeable environment for the local community to enjoy.