

Estimating vehicle trips at mixed-use developments can be challenging. Most traditional trip generation rates are based on single-use suburban sites and don’t account for how people actually travel in mixed-use developments (MXD), where trips can happen internally or by walking, biking, or transit.
This white paper presents how we recalibrated and validated our MXD tool to reflect 2019 travel conditions. The update incorporates changes in travel behavior over the past decade, including the rise of ride-hailing services, e-commerce, telecommuting, and micromobility.
Using observed traffic data from mixed-use sites across the US, the updated MXD model produces more accurate estimates of daily and peak-hour vehicle trips, helping planners and communities better evaluate the transportation impacts of mixed-use developments.
Ready to read the white paper? Click the button below to access.
share this article
Contributor

John Gard
Principal
Email Me
Explore More
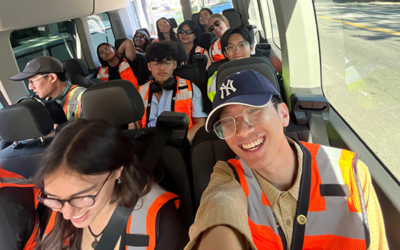
Inside Our Summer Intern Program
Turning Data into Transit Currency
See how three U.S. cities are using data-driven storytelling to connect transit to daily life, reshaping it into something people want to ride and invest in.

Olympic-Size Mobility
Olympic fever fills the air as Paris hosts the 2024 Games, welcoming millions of visitors. Meanwhile, Los Angeles gears up for the 2028 Olympics, focusing on improvements that will benefit the city long after the games end.