
Encouraging Resiliency During Evacuations

Encouraging Resiliency During Evacuations
In the face of increasing natural disasters and disruptions related to climate change, many cities and counties are thinking about their transportation networks with a greater focus on creating access and moving people safely in an emergency.
City roadways are typically sized based on the traffic generated during an average weekday, a common practice known as the 30th highest hour. When considering evacuations, however, cities and counties need to think differently. As related legislative requirements grow, many developers must also consider evacuation analysis for new developments.
How will people travel during an evacuation?
What routes will they take?
How will evacuations interact with other travel that is occurring in and around evacuating areas?
Understanding Evacuation Travel
Fehr & Peers recently partnered with the City of Rancho Cucamonga as they were preparing to update their General Plan. The city has a lot in common with many California cities when it comes to the hazard risks they face: high fire danger, potential flooding, and active fault lines.
As a follow-up to the expansive and proactive Resilient IE effort completed by Western Riverside Council of Governments, city officials in Rancho Cucamonga wanted to better understand how their transportation system could be augmented to help with egress in the event of a disaster. But how?
Evacuations cause extreme travel behavior that traditional assessments are not entirely equipped to evaluate. Their unpredictability in terms of scope and speed make it impossible to replicate real-life scenarios. To best inform decision makers, residents, and policy, Rancho Cucamonga needed a finer-grained solution to see where people might be in the event of a disaster and the demand this would create on the transportation system at any point, day, or night.
In partnership with the city, we developed and customized a new tool, Evac+, that integrates with travel demand models to provide a dynamic look at the most vulnerable areas furthest from evacuation centers or options to exit the city. It also reveals differences in the time it would take to evacuate, under current conditions, and in different disaster scenarios.
With a greater understanding of how travel interacts with background traffic, the city was able to create an Evacuation Assessment that shows which roadway investments would help the entire network during an evacuation event, improving circulation and connectivity to areas that are more isolated.
Pulled from the Evacuation Assessment, the following show the distance from various neighborhoods to the city boundary, along with two outputs from the Evac+ tool, illustrating the time evacuate specified areas and a route stress test by time for a proposed evacuation scenario.
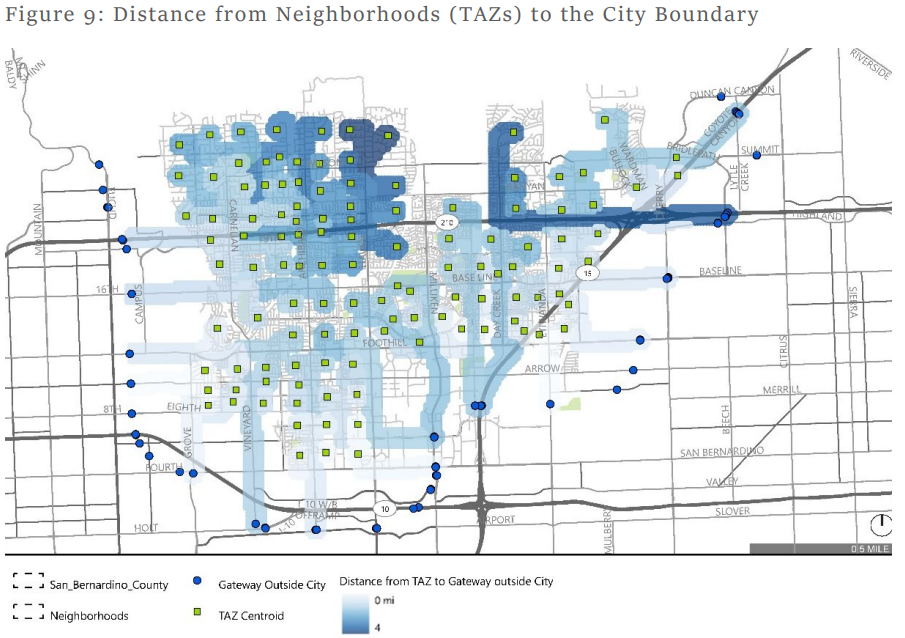
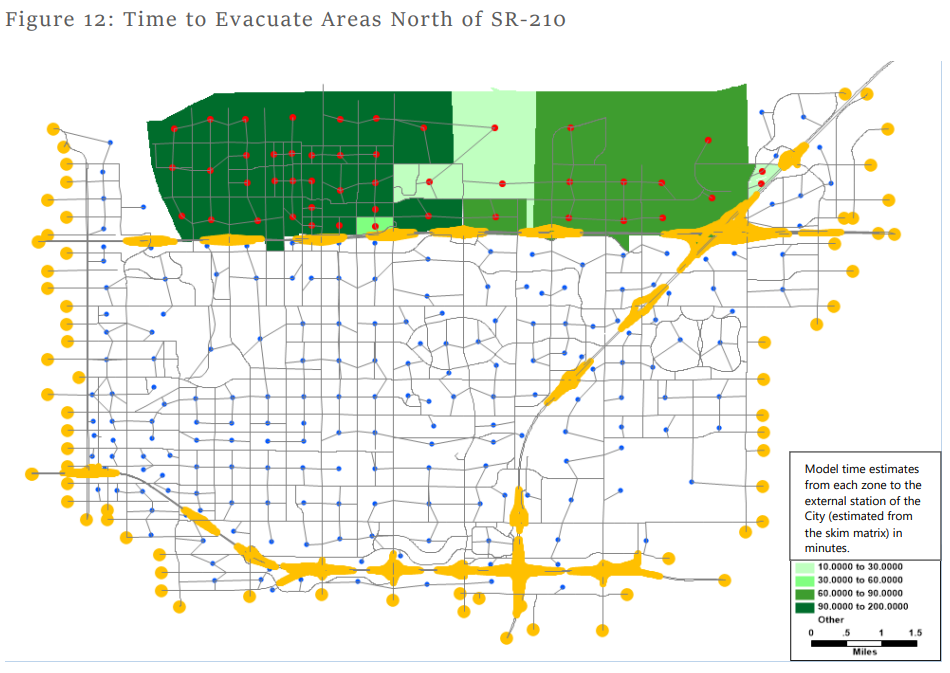
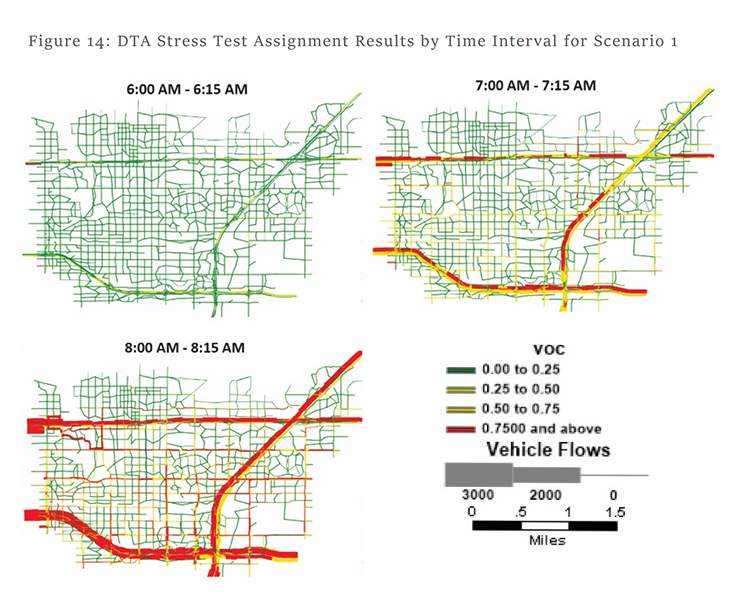
As recent natural disasters have proven year after year, the worst time to update an emergency plan is during an emergency evacuation. Though the hope is that these plans never have to be tested, defining key exit points and identifying potential problem areas early on can help the members of a community feel more prepared and resilient in the event of a disaster.
Interested in learning more about this study or customizing Evac+ for emergency planning in your community?
share this article
Explore More
Looking at Street Safety Through the Lens of Kinetic Energy
This ITE Technical brief explores how kinetic energy can add another dimension to roadway safety analysis, helping practitioners consider where conditions for serious harm may exist even before severe crash patterns emerge.

Understanding AI’s Role in Transportation Safety
AI is giving transportation safety practitioners new ways to analyze data, detect near misses, and respond to risk before crashes happen. Real-world examples from Bellevue, WA and San Bernardino, CA show where AI-supported technology is delivering value—and where human judgment remains essential for turning data into responsible safety decisions.
New NCHRP Toolkit Helps Agencies Build Safety Into Everyday Decisions
Making streets safer takes more than individual projects. Our new Safe System approach toolkit, developed through NCHRP Research Report 1181, helps agencies integrate safety into policies, budgets, design standards, and land use decisions. Explore practical tools, real-world case studies, and new IIHS Safe System success stories that show how agencies are turning safety into standard practice.