
Bike & Bus Interaction on Our Streets

Bike & Bus Interaction on Our Streets
Fehr & Peers recently partnered with LA Metro on a comprehensive review of bike/bus interactions in Los Angeles County, and together we developed a set of design and education recommendations that may be applied anywhere in the United States. We invite you to take a look!

Recommendations for Success
Design bikeways with clear, consistent, and gap-free striping/signage
On streets where separated facilities are not provided, designating space through clear and consistent striping/signage makes bicyclists and bus operators feel more comfortable about sharing the road with one another, largely by knowing where to expect each other.
Having some treatment – even the basic, standard bicycle lane – is better than having no treatment at all, and the benefits extend to protecting people on bikes from general motorists too.
Consider other specific treatments proven to improve interactions
The details of specific treatments, such as constructing boarding islands, guiding users through intersections, and applying considerations for shared bike/bus lanes, are contained within the Bike/Bus Interaction on Our Streets guidebook.
Procedural recommendations for city planners and transit operators to improve the design and feedback process are found in the guidebook and in the accompanying Bike/Bus Interface Study report.
Encourage educators to emphasize “seeing the counterpart’s perspective.”
We present a set of materials and techniques for transit operators and bicycle educators to include in training materials. For example, people on bikes can learn about the limitations for bus operator visibility and maneuverability that would affect how a bicyclist behaves around either a moving or stopped bus. Bus operators are recommended to experience riding a bicycle to help them understand the speed of decision-making from people on bikes, and to improve their ability to anticipate rapid maneuvers.
Guided by Personal Experiences; Grounded by Data
Data analysis only quantifies what can be readily observed and gives no indication of what isn’t happening and why. It tells us little about how people felt, which is what influences behavior and choices. Therefore, identifying what works and what doesn’t work requires a blend of data analysis and canvasing personal experiences.
For this study, we listened to personal stories and experience of dozens of bus operators and people on bikes to paint a fuller picture of what does and doesn’t work. Our accompanying analysis was thorough, consisting of 15 case study corridors throughout Los Angeles County, and considering roadway conditions, operations, volumes, and safety before and after a facility design change.
Standard Bike Lanes
7th St | Main St | Pacific Ave | San Pedro St | Van Nuys Blvd
Buffered Bike Lanes
Alamitos Ave | Colorado Blvd | Venice Blvd
Separated Bike Lanes
Broadway | Los Angeles St | Reseda Blvd | Rosemead Blvd
Shared Bike-Bus Lanes
Figueroa St | Sunset Blvd | Wilshire Blvd
How can we support bike/bus interactions in your community?
share this article
Explore More
MXD Gets Its Biggest Update Yet
Our Mixed-Use Development (MXD) tool just got its biggest update in more than a decade. Built on expanded national research and updated ITE trip rates, the 2026 release delivers more accurate, context-sensitive trip estimates for mixed-use places, including validation using post-COVID field counts.
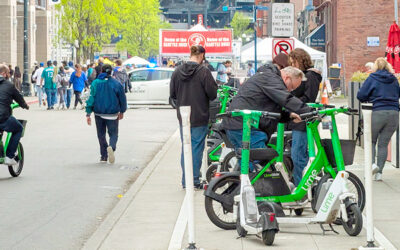
A Design Win for Seattle Sidewalks
Micromobility is growing, but when scooters and bikes have nowhere obvious to park, sidewalks suffer. Seattle tackled this with quick-build corrals, using simple outlines to guide parking right away, then upgrading to durable markings and in-street designs. See how we helped screen sites, refine locations in the field, and scale for daily use and major events.

Jason Xu Joins Fehr & Peers as Principal
Meet Jason Xu and his approach to improving transportation operations, signal systems, and corridor coordination.