
Equity & Infrastructure Improvements

Equity & Infrastructure Improvements
Large-scale public infrastructure projects are intended to better the lives of community members and roadway users. These projects have the potential to transform corridors with investment levels of each project reaching into the hundreds of millions. The goal of this investment is to benefit travelers and local communities: faster and more reliable travel times, new multimodal travel choices, and fewer collisions. But does current practice evaluate which community members and roadway users are actually benefitting from these large-scale projects?
To answer this question, we have conducted a case study in the Sacramento region of California that showcases how activity-based models (ABM) can be used for transportation equity analysis. This study finds that ABMs can be used to better understand the sociodemographic characteristics of travelers who are likely to benefit from specific large-scale infrastructure projects.
Sacramento Region Case Study
Sacramento Region Infrastructure Projects
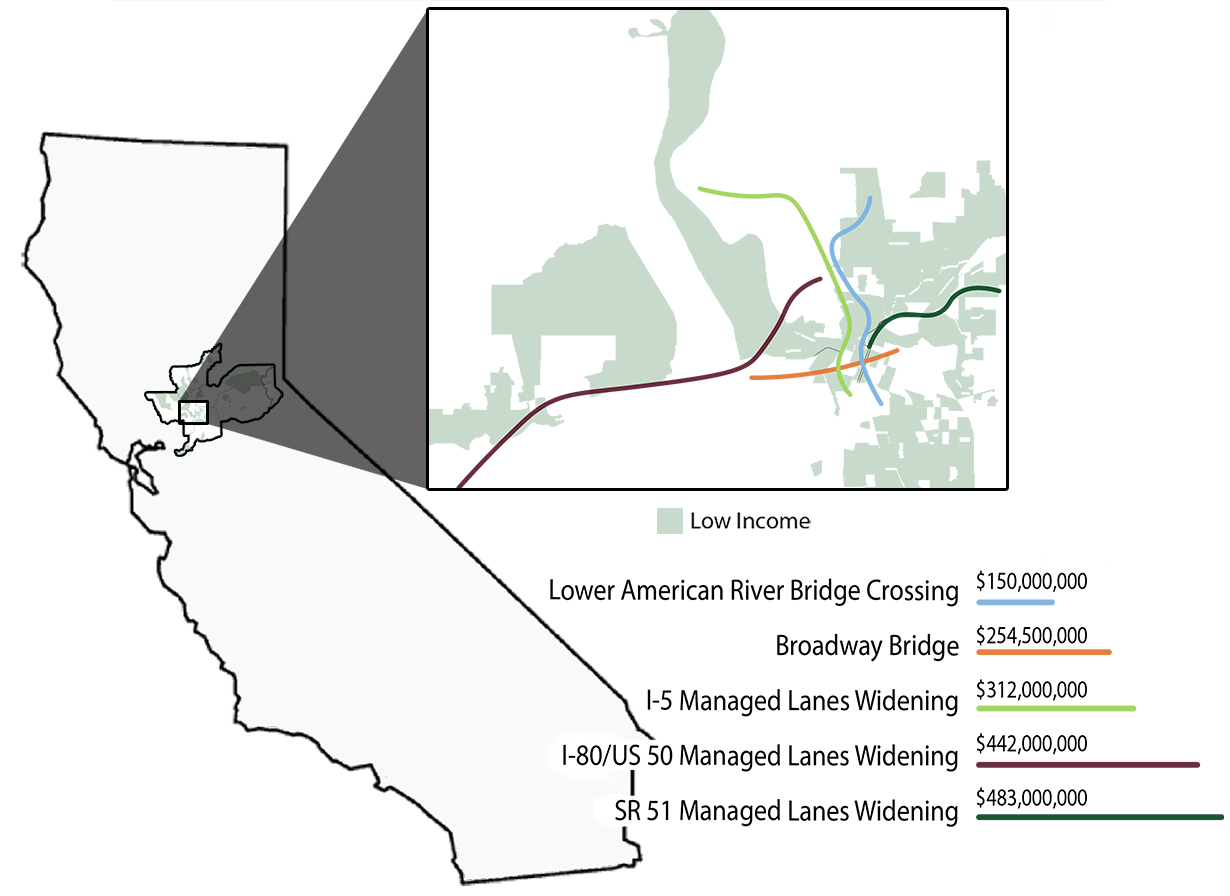
The Sacramento region for this evaluation consists of six counties in Northern California: El Dorado, Placer, Sacramento, Sutter, Yolo, and Yuba. Areas considered primarily low-income are highlighted on the map below. The chart beneath the map lists the five most expensive future roadway infrastructure investments planned for the Sacramento region listed in the Sacramento Area Council of Governments (SACOG) 2020 Metropolitan Transportation Plan /Sustainable Communities Strategy (MTP/SCS). These projects have a total investment of $1,641,500,000.
ABM Methodology
Methodology
In transportation planning, ABMs simulate people’s daily activities and travel patterns. These models predict the amount and characteristics of roadway users. Using the SACOG SACSIM19 and Replica ABMs, we analyzed the following key characteristics of travelers assigned to each of the above projects.
- Traveler Origins & Destinations
- Age, Race, Gender, and Income Distribution
When we compare the demographic characteristics of travelers by each project, and then to regional averages, we see more clearly who infrastructure dollars are benefiting. These models can also be used to analyze how increased vehicle travel impacts adjacent communities using metrics such as VMT exposure per capita.
Equity Effects
SACSIM and Replica Model Results
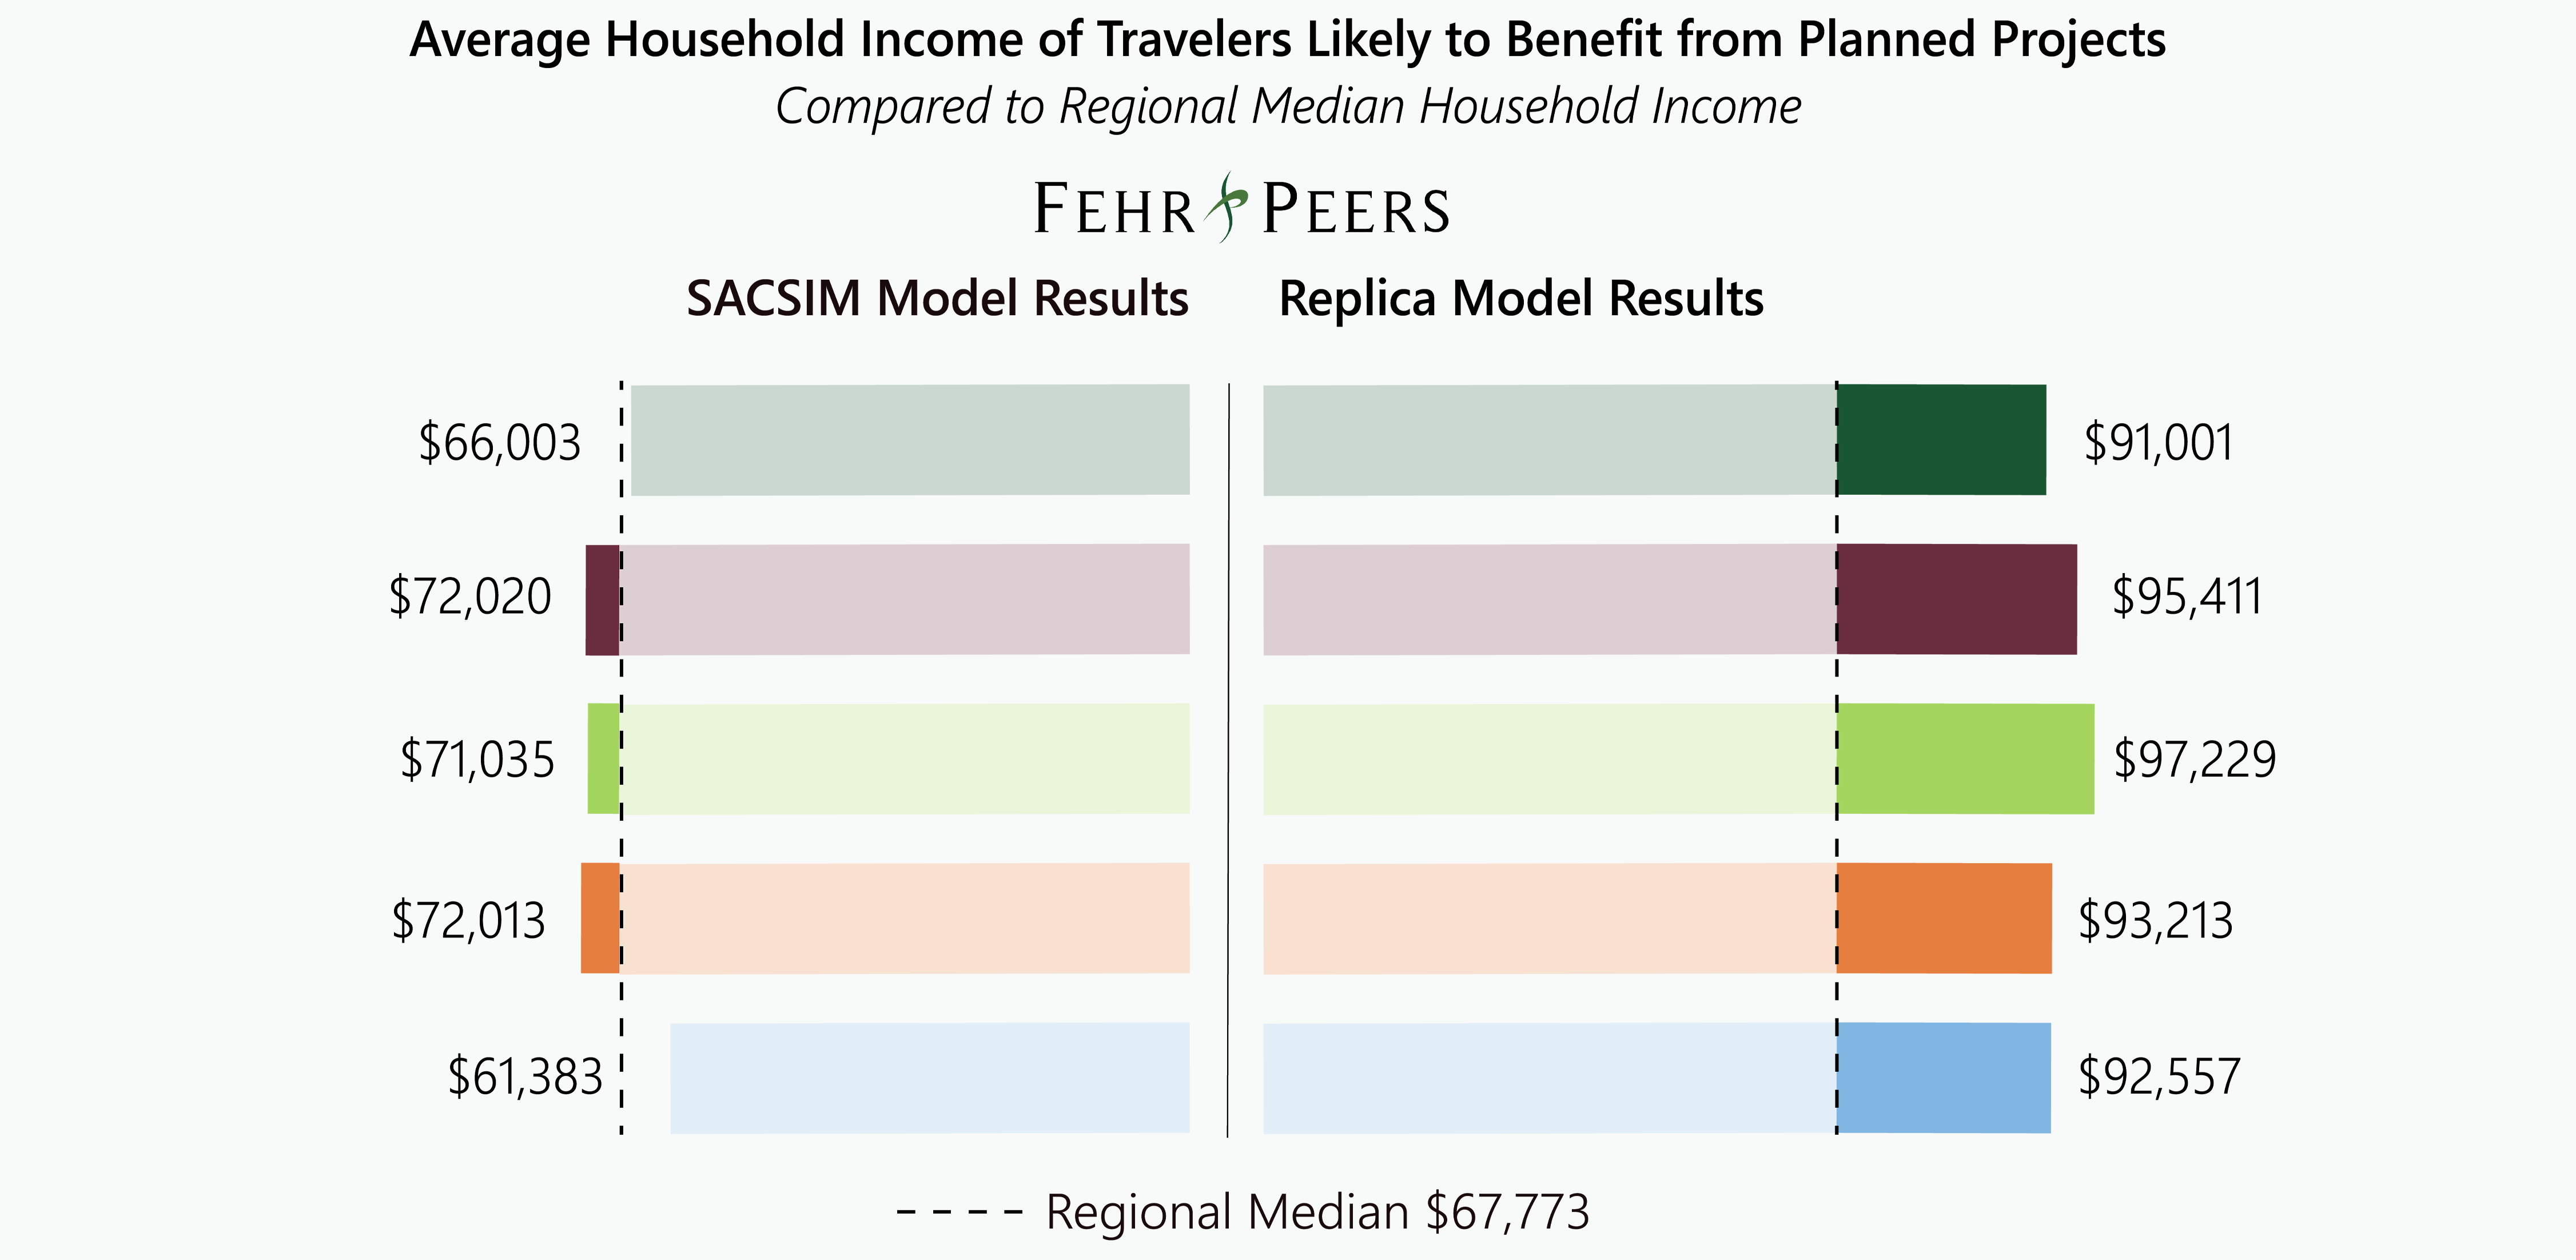
This Sacramento region case study uses two ABMs to identify income distribution of travelers for the five projects based on tracking individual travelers that use the improved roadways. Each traveler on the improved network is identified and then their travel path from origin to destination is tracked. This allows demographic information associated with the traveler to be determined. These users of the managed lanes or new roadway connection are the ones most directly benefitting from the projects. The analysis results are summarized and illustrated below.
- The SACSIM19 model shows that travelers with higher average household incomes are likely to benefit from three of the five projects (I-80, I-5, and Broadway Bridge). The other projects’ travelers were shown to have similar household incomes compared to the regional average.
- The Replica model example indicates that those with higher average household incomes are most likely to benefit from all five of the SACOG projects.
What This Means For Future Projects
This study has a wide range of potential applications for public agencies for allocating public funding in an equitable manner including prioritizing projects with more equitable outcome.
Evaluation of race, gender, and age of travelers can reveal more about the planned transportation systems and how they may improve communities.
share this article
Explore More

Cathleen Sullivan Joins Fehr & Peers
Our new Principal Cathleen Sullivan brings a practical, people-centered approach to transit and multimodal planning, helping Bay Area agencies turn complex ideas into progress.

Get a First Look at the Generative AI Policy Starter Kit
We helped develop a new Generative AI Policy Starter Kit through ITE. Explore the Quick Bite and ITE Journal article now, and stay tuned for the full kit.
Intern Perspectives: A Summer in Transportation
What does a transportation internship actually look like? This summer, 25 interns across 14 of our offices gained hands-on experience with fieldwork, street design, GIS, data analysis, visual communication, client work, and community engagement. See what they learned, what surprised them, and how the experience shaped the way they think about careers in transportation.