AN OVERVIEW OF
Our Transportation
Consulting Tools
Custom tools and resources providing answers tailored to your community’s unique needs
Choose your own adventure
What Interests You?
Smart Growth
Inform short-term decisions so choices are resilient and sustainable for the future
Multimodal Performance
Evaluate options for improving or minimizing impacts on the built environment and rider experience across modes
Systems
Explore the combination of travel demand and services
Outreach
Engage stakeholders and community members to gain valuable insight on needs, concerns, and ideas
Ask us about
Our Library of Tools
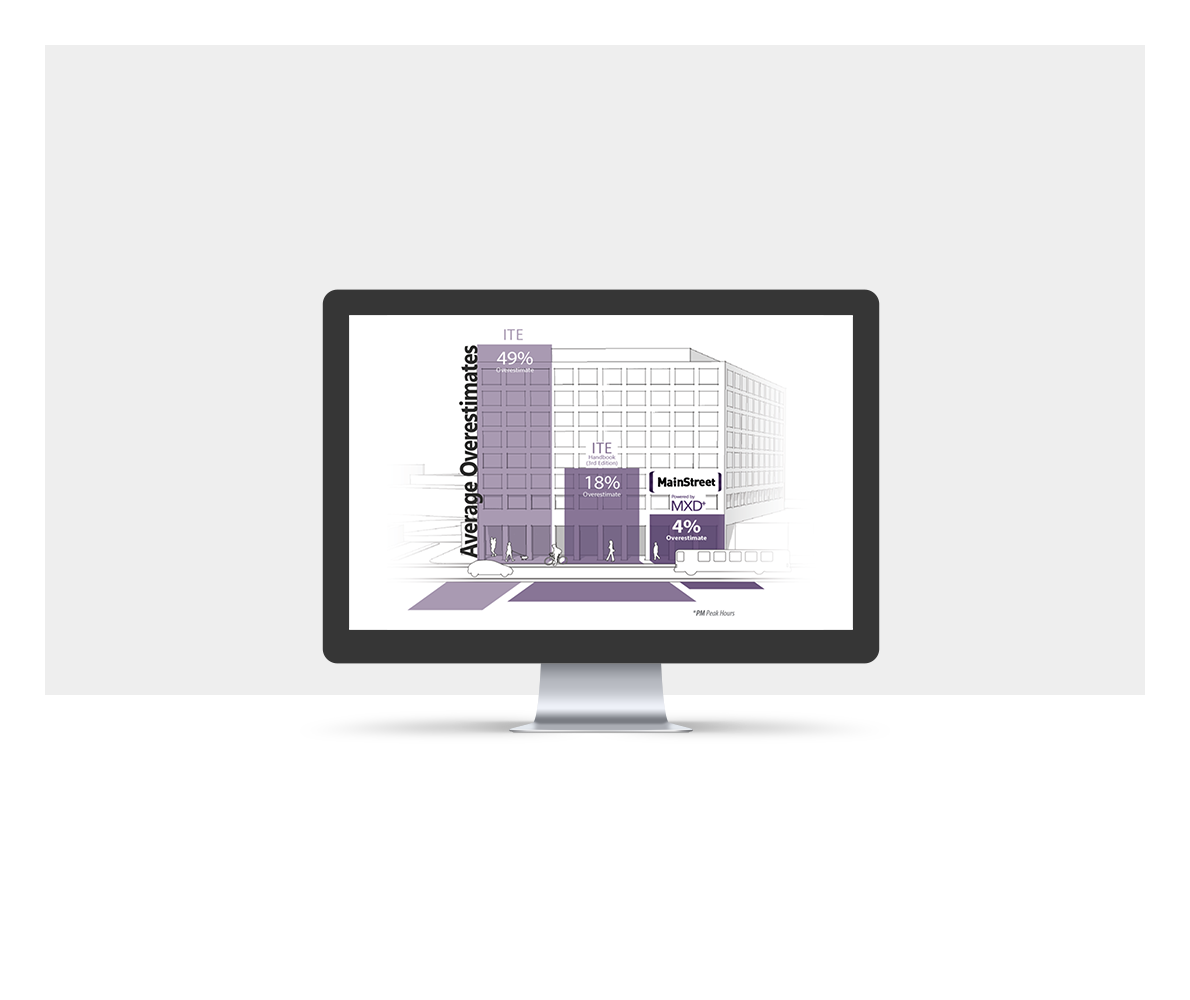
MainStreet/MXD+
Calculate trip generation based on the built environment more accurately than with industry standard methods
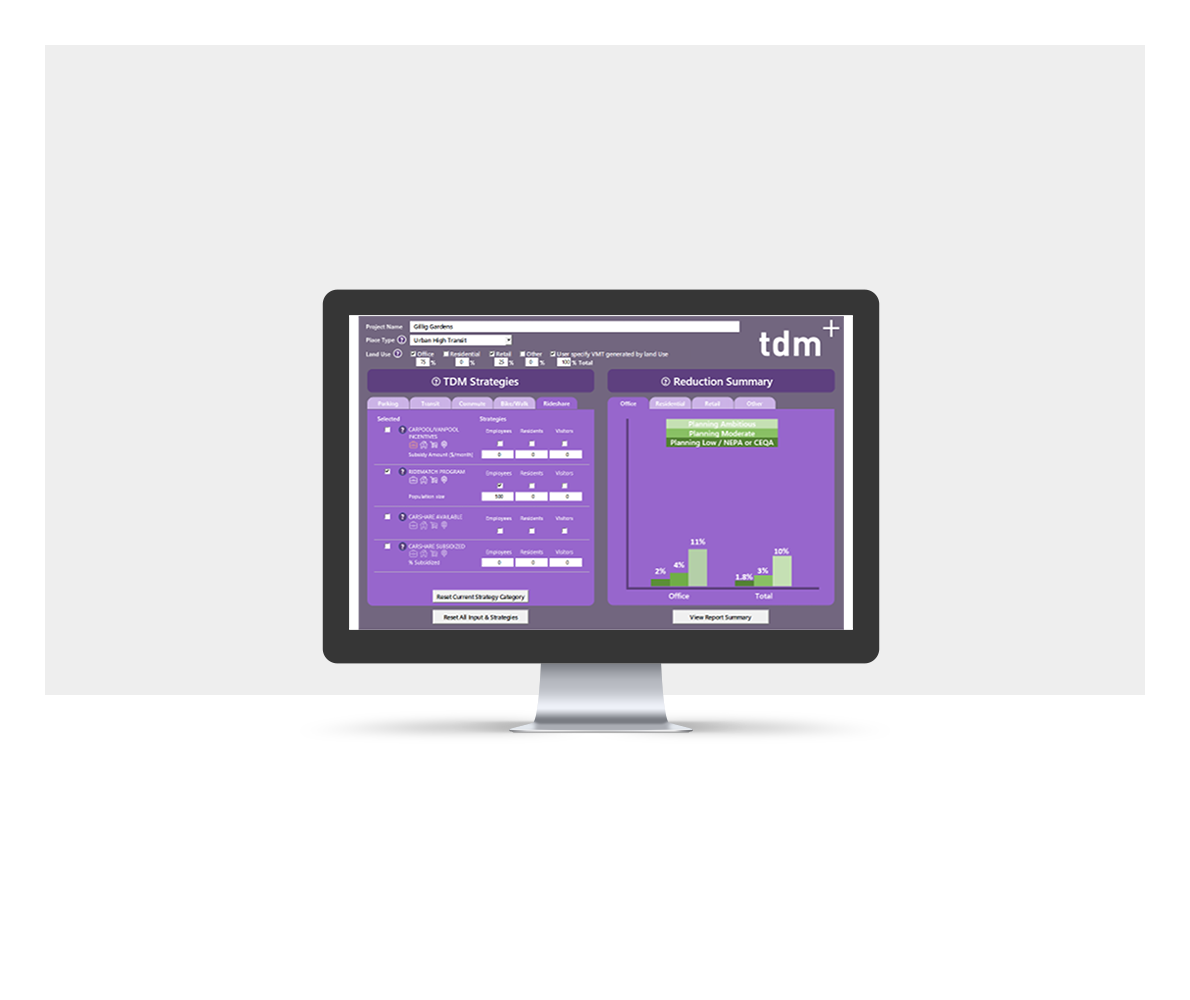
TDM+
Estimate how a transportation demand management plan affects vehicle trips and corresponding vehicle miles traveled
*Valuable for developers or cities trying to minimize the transportation impacts of new or infill development
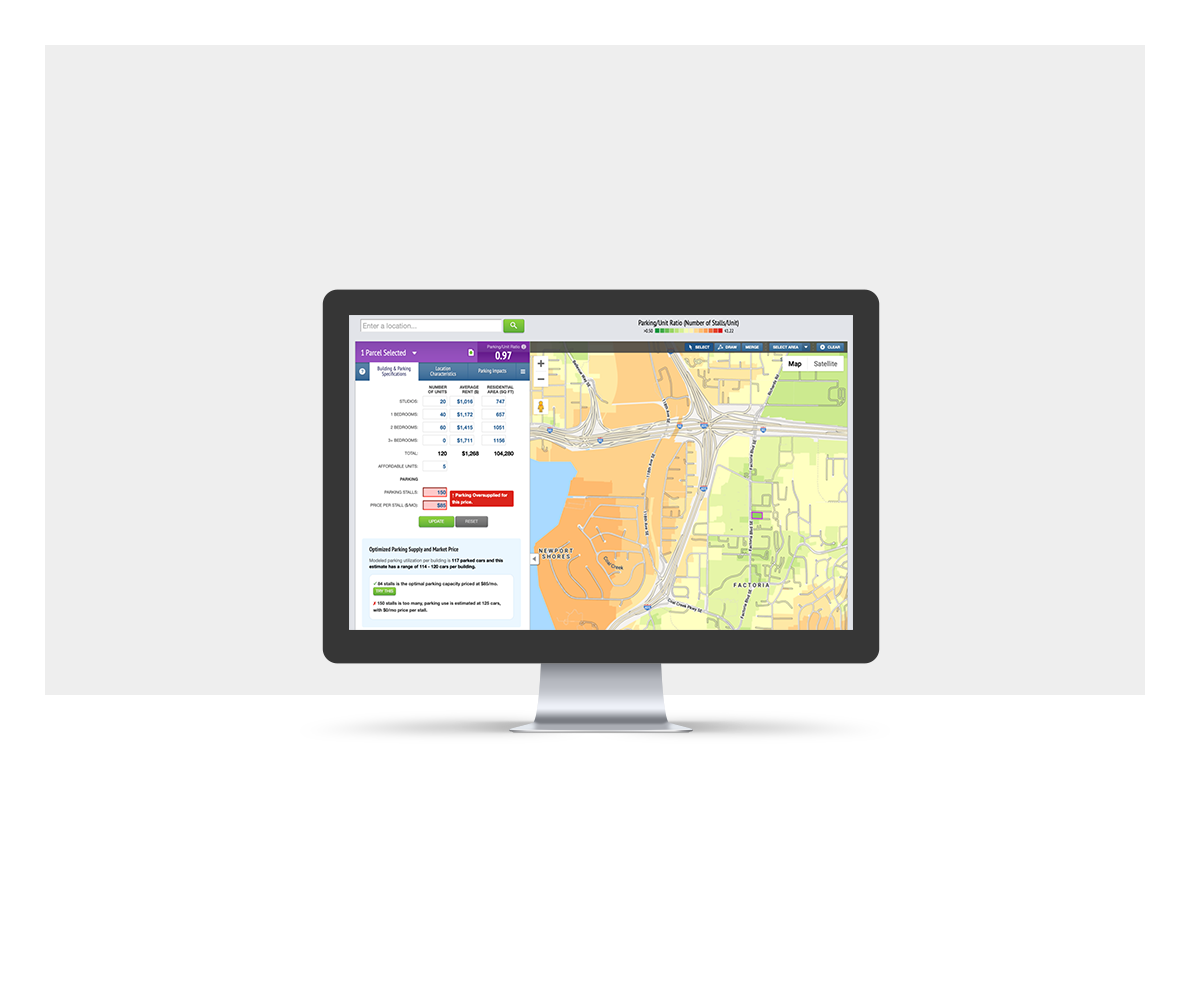
Parking+
Understand the tradeoffs between adding parking versus accommodating travel with other modes
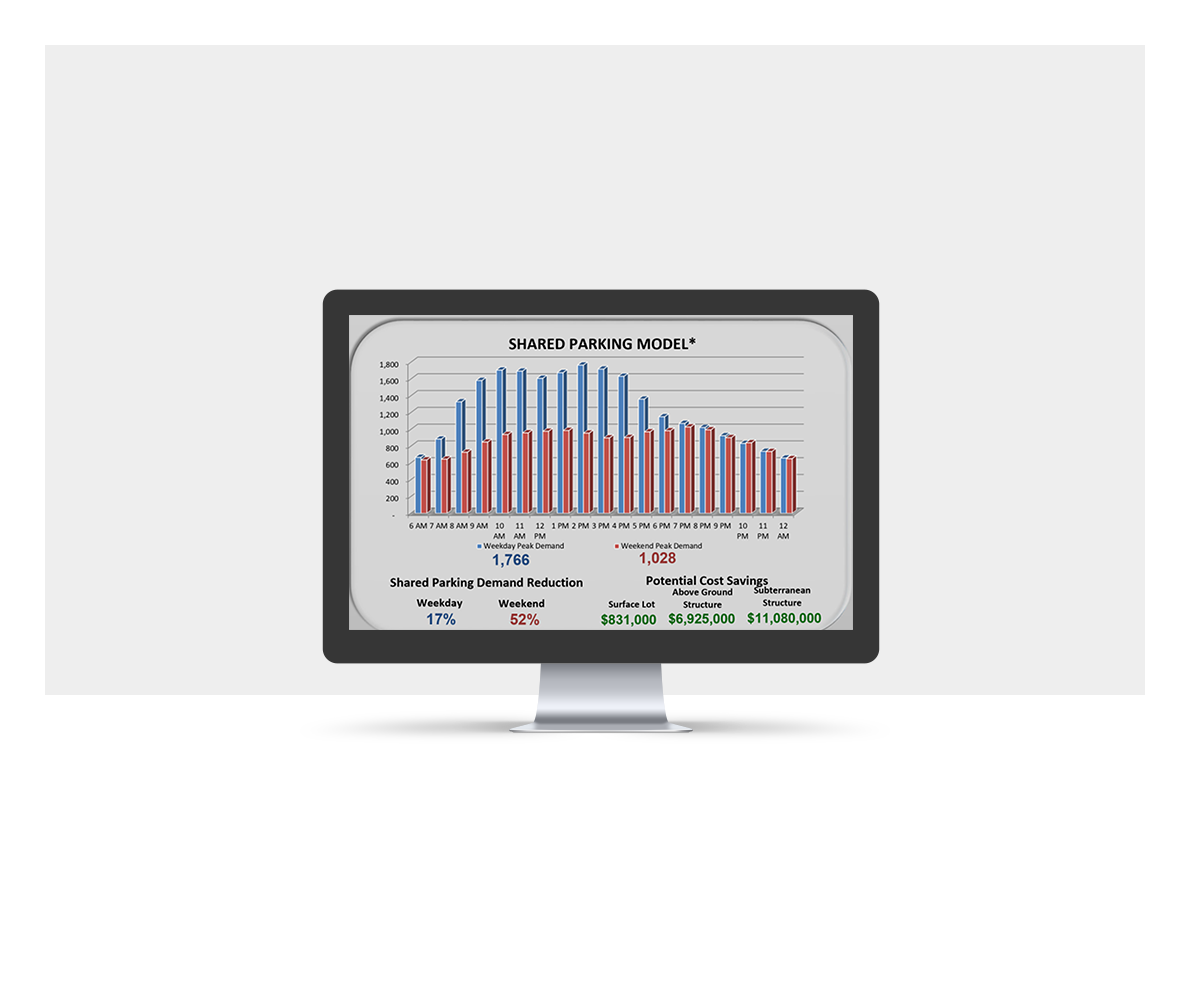
Plan+
Identify the traffic and parking parameters that will achieve the greatest transportation for a development site, in terms of maximizing parking resources or capturing trips internal to the site
StreetScore+
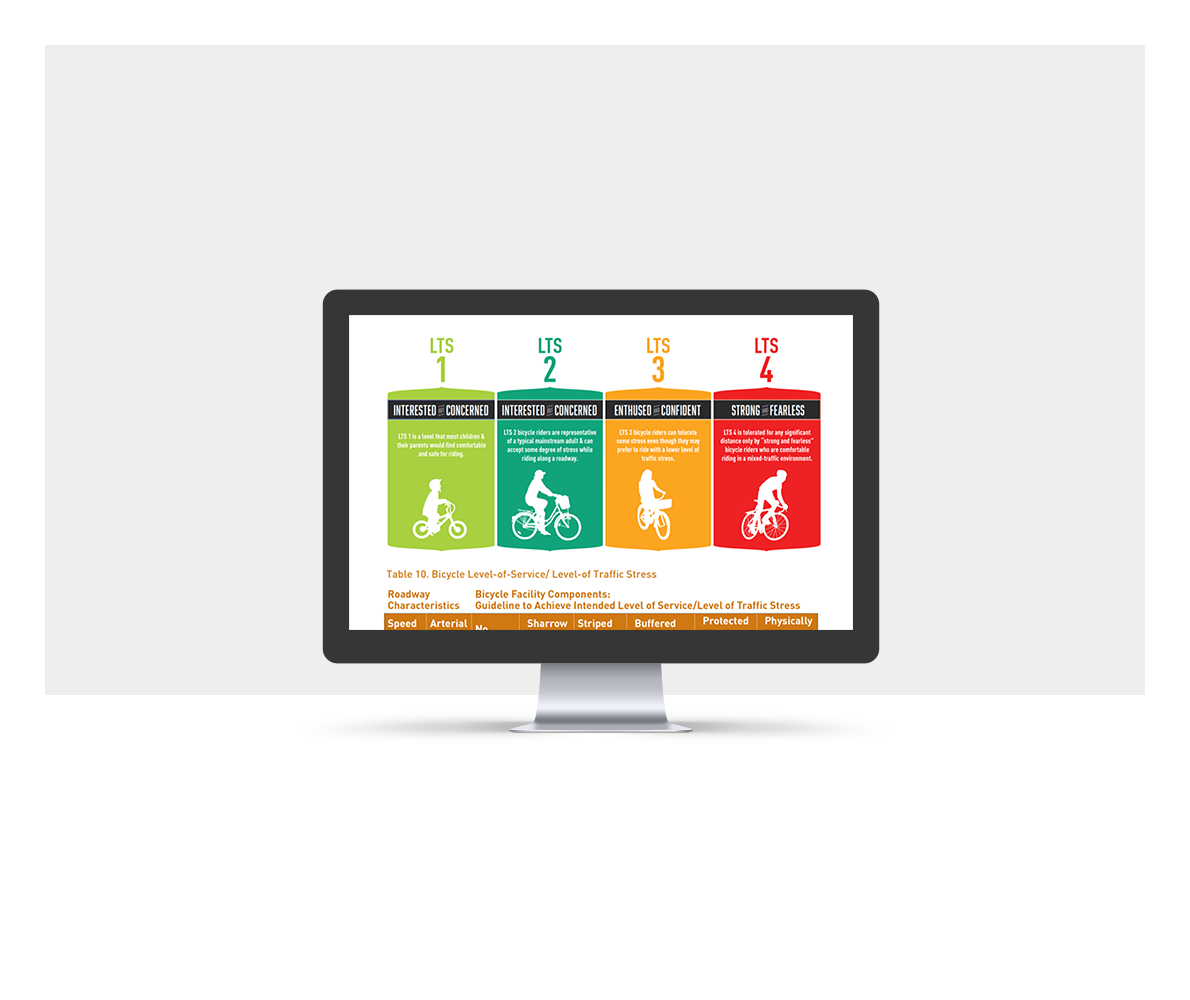
Assess large areas of a community quickly for how well the transportation system accommodates pedestrians and cyclists; rapidly test many different potential improvement options
PersonDelay+
Gather a complete picture of how intersection operations and potential mitigation affect all users
Crosswalk+
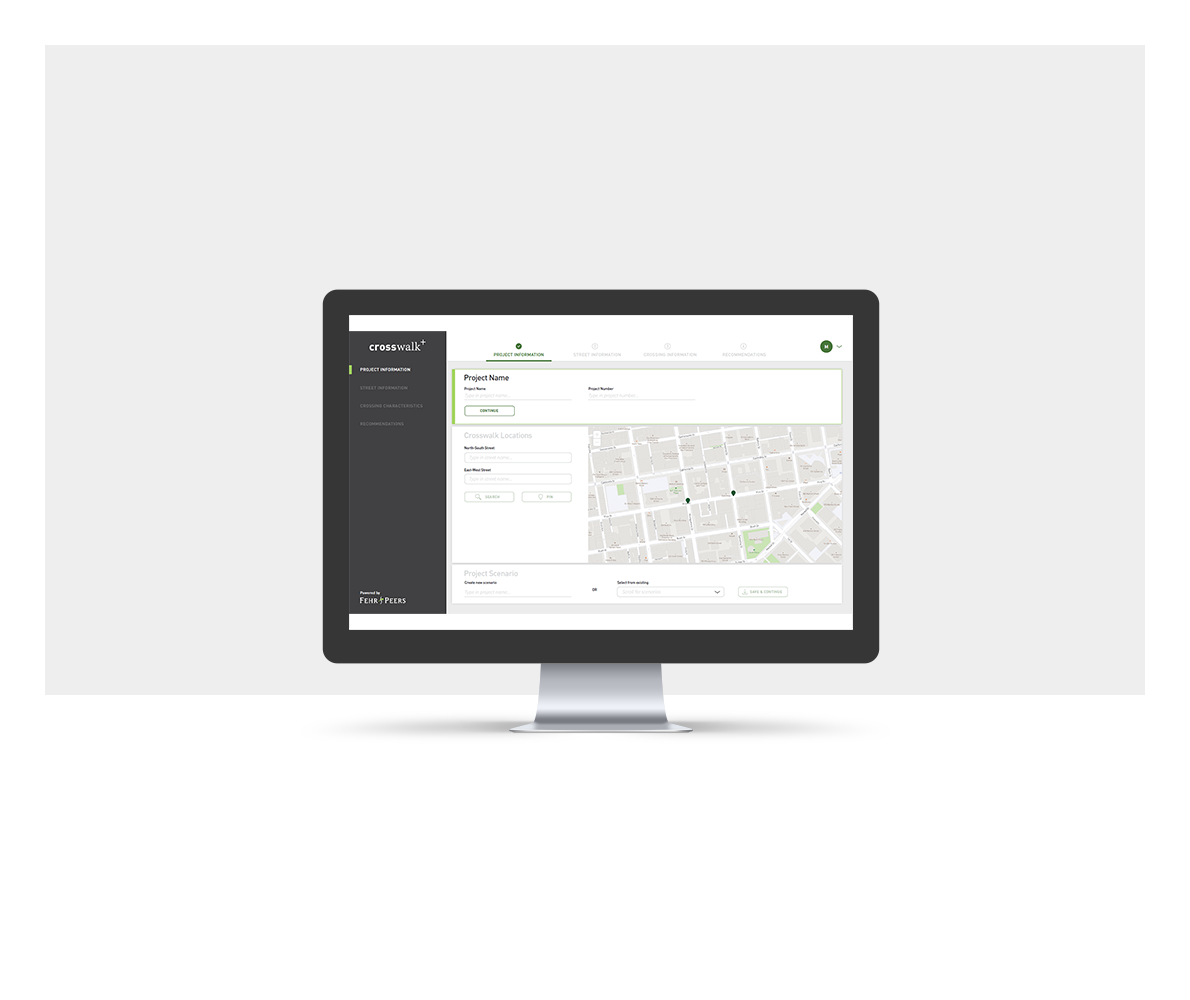
Guide the selection of crosswalk types and possible safety countermeasures by location
Ridership+
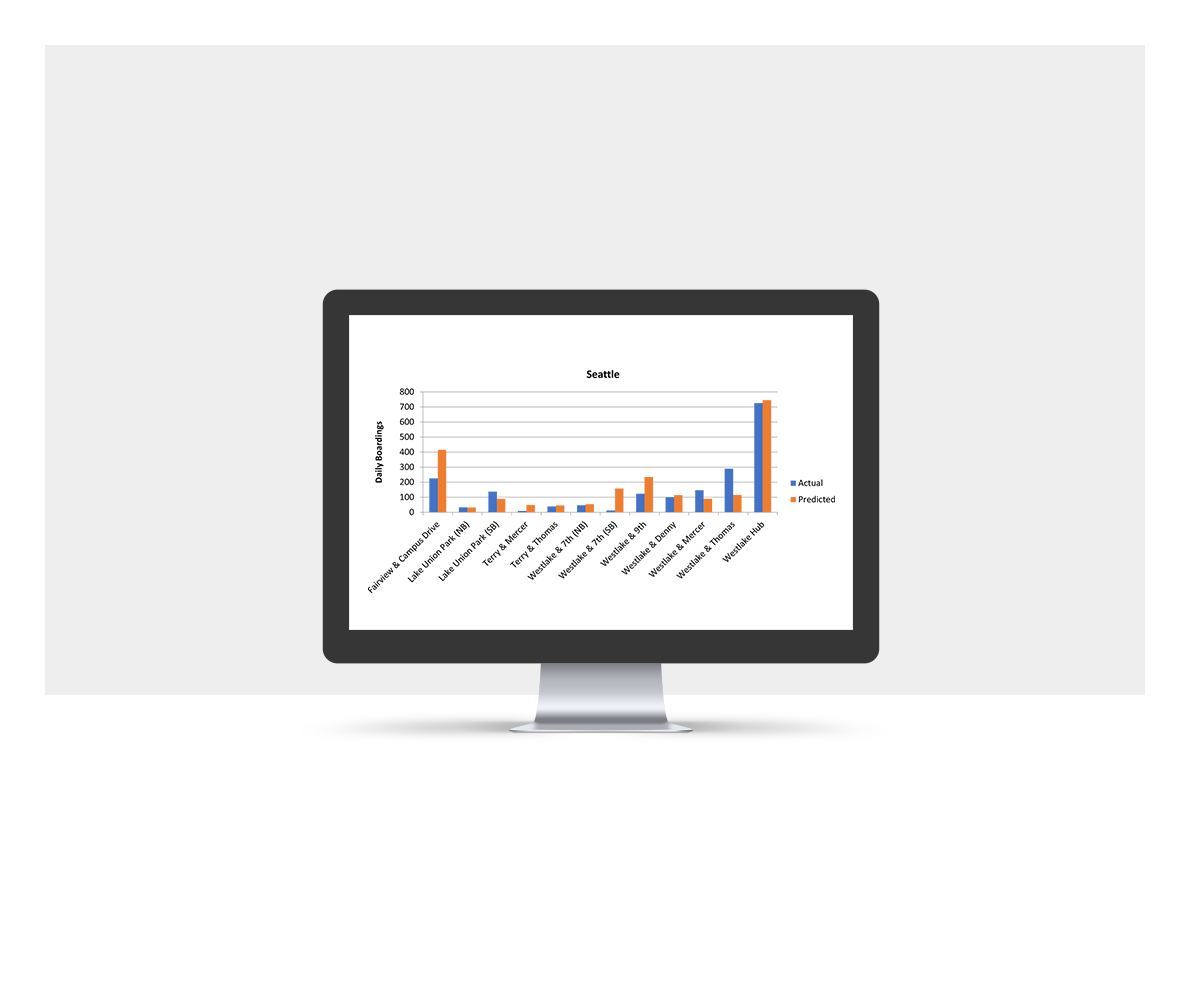
Estimate transit ridership by station quickly; accurately forecast changes in ridership based on land use changes and transit service characteristics; perform analysis much faster and more accurately than with traditional travel models
Reliability+
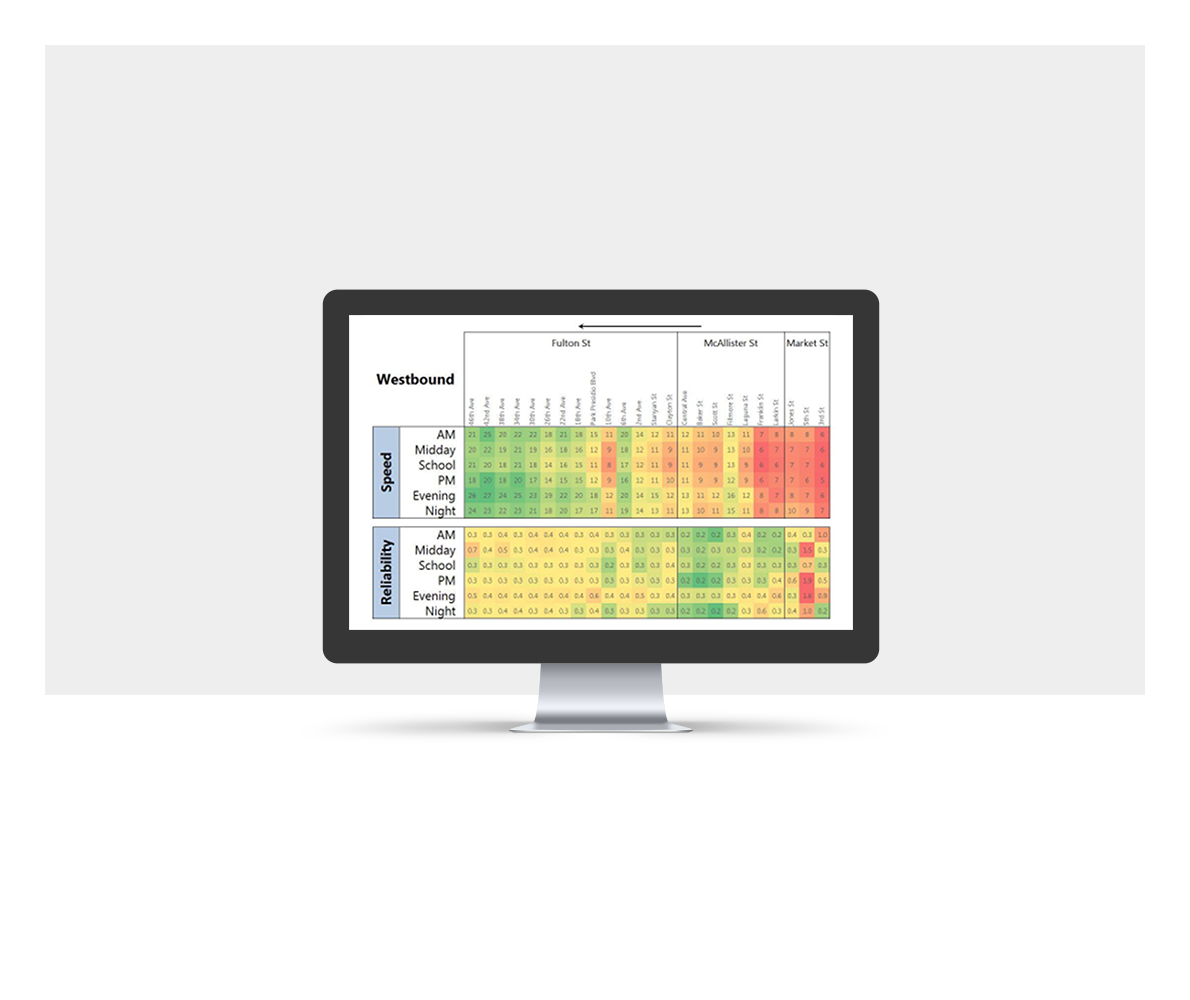
Transform transit data sources into performance metrics around speed, travel time, and reliability for corridors and routes
Active+
Understand the relative utilization of street segments and intersections for walking and biking trips based on facility characteristics and adjacent land uses
MMLOS Toolkit
Consider options and best practices for assessing level of service for all modes
Curbspace+
Assess the highest and best use of curb space given competing needs based on number of trips likely to be served. Customizable to a specific area or street based on local observations.
TravelAccess+
Measure quickly how well transportation networks connect to destinations; expose potential equity limitations that may be causing difficulties for some users or geographic areas
Evac+
Evaluate the capacity, safety, and viability of evacuation routes under a range of emergency scenarios
Equity
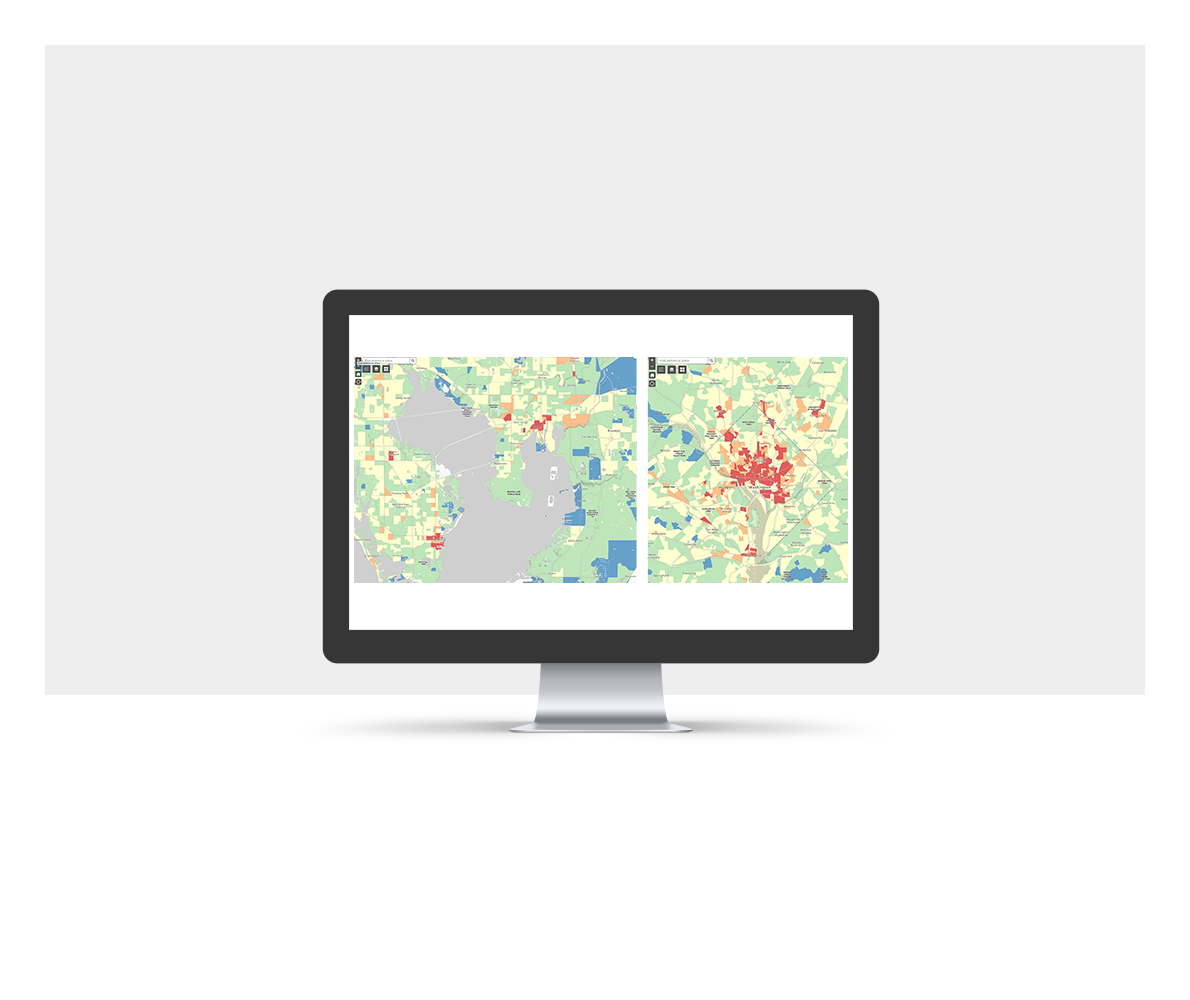
GIS-based tool for mapping equity populations and conducting spatial analysis to discern disparate conditions for populations
Micromobility Suitability Index
Identify where transportation network and land use characteristics are favorable for deploying shared electric mobility devices (scooters and bikes)
Safety Data Dashboard
Visualize and analyze safety data in real time to help prioritize investments, prepare for grants, or answer community questions about transportation safety
TravelCast
Provide a high-level evaluation of alternative network travel routes due to construction activity
TrendLab+
Forecast the effects of disruptive economic and transportation trends on vehicle miles traveled and transit use
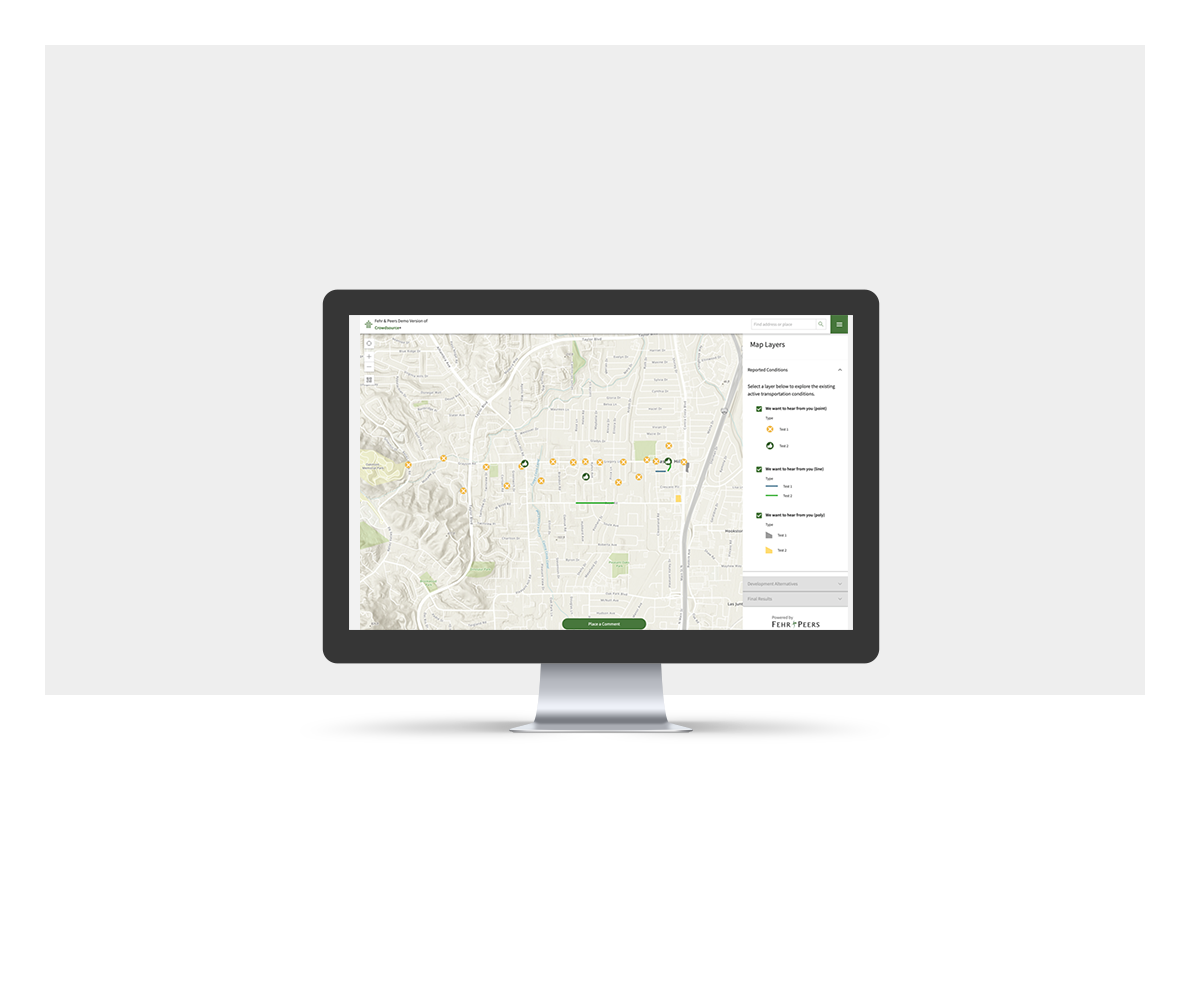
CrowdSource+
Capture location-specific community feedback on transportation pain points, improvement suggestions, and mobility preferences
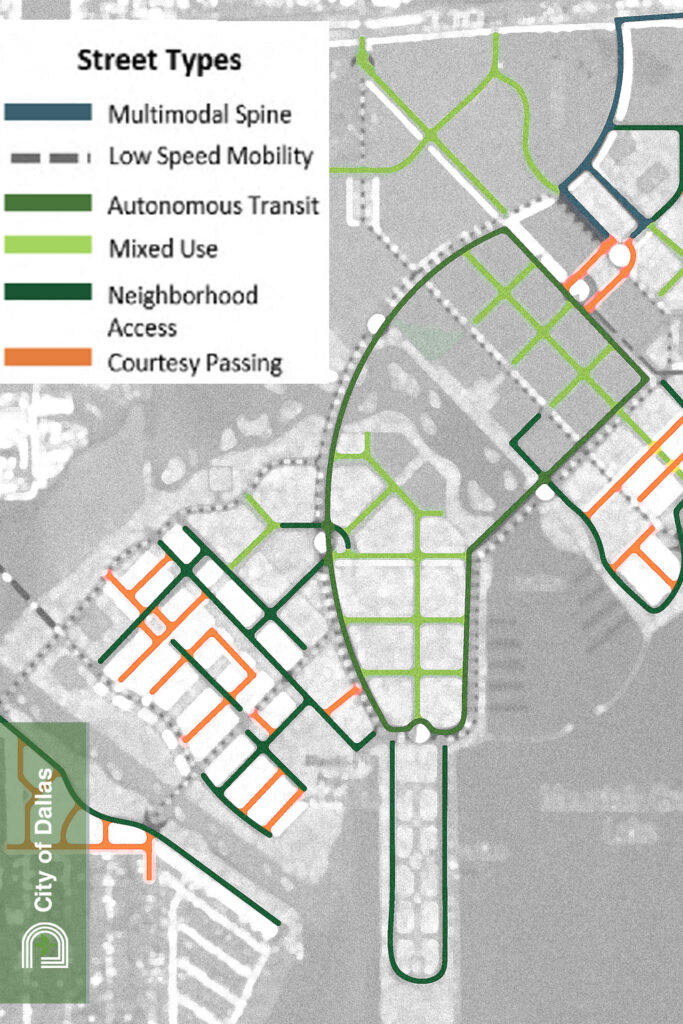
Smart Growth
Re-envisioning a 738-Acre former Naval Air Station
Striving for a walkable community to reinvigorate the area and support climate, housing, equity, and economic development goals for their community.
MainStreet/MXD helped:
– Optimize land use and connectivity
– Identify transit potential
– Appropriately scale roadways
MainStreet/MXD+
Calculate trip generation based on the built environment more accurately than with industry standard methods
TDM+
Estimate how a transportation demand management plan affects vehicle trips and corresponding vehicle miles traveled
*Valuable for developers or cities trying to minimize the transportation impacts of new or infill development
Plan+
Identify the traffic and parking parameters that will achieve the greatest transportation for a development site, in terms of maximizing parking resources or capturing trips internal to the site
Parking+
Understand the tradeoffs between adding parking versus accommodating travel with other modes
Estimate how a Transportation Demand Management Plan affects vehicle trip generation and corresponding vehicle miles traveled
*Valuable for developers or cities trying to minimize the transportation impacts of new or infill development
- Rigorous statistical analysis
- Measures programmatic mitigation
- Reduces transportation infrastructure
- Parking pricing/policies
Multimodal Performance
Transforming a 4-Mile Residential Corridor
Defining a cohesive Complete Streets vision to convert a corridor from auto-oriented to multimodal using strategies that improve the safety, accessibility, health, and comfort for all users of the corridor.
StreetScore+ quantified:
– Level of stress for bikeway users (high)
– Improved comfort for proposed improvements
– Crosswalk+ to identify crossing improvement
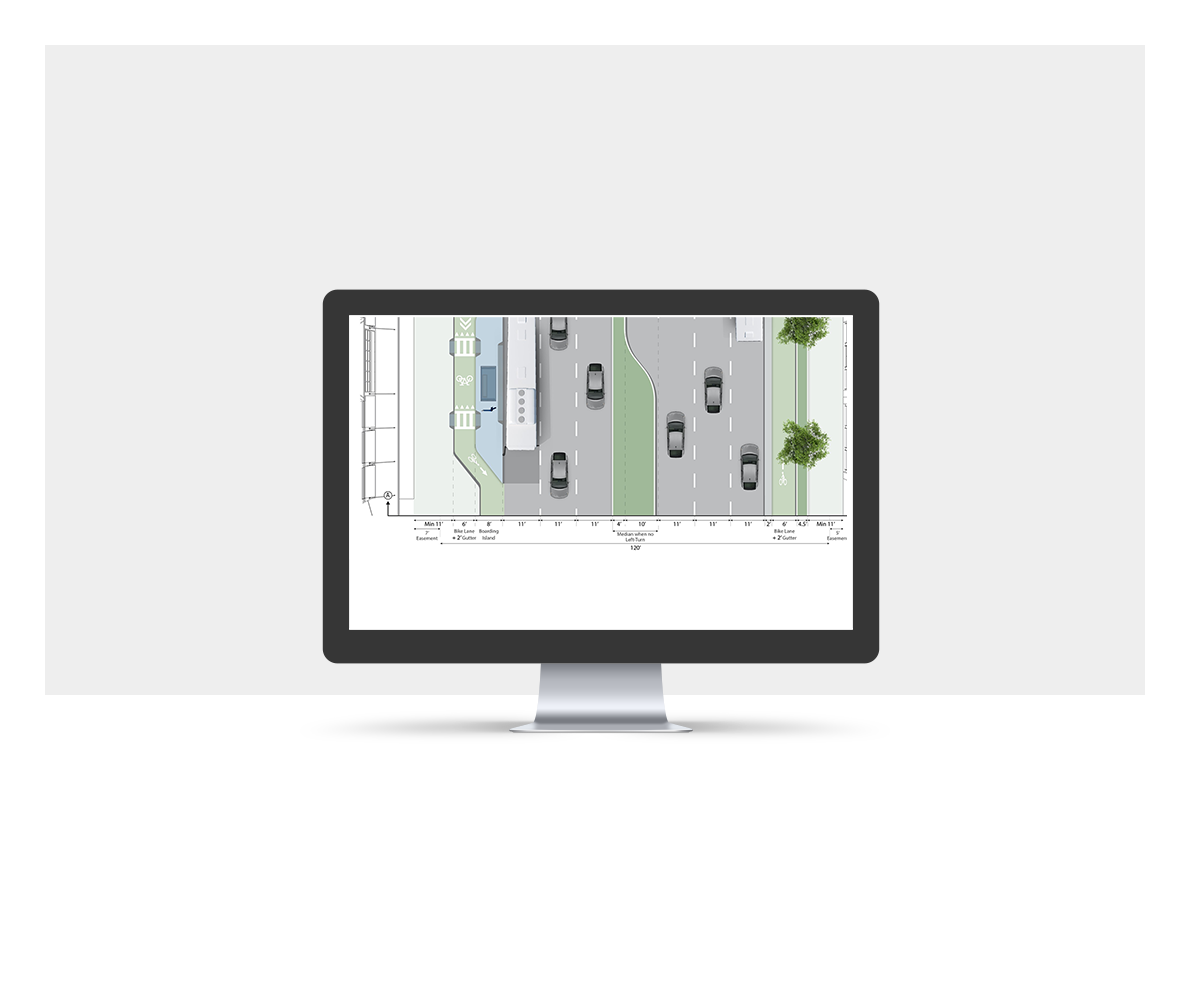
Streetscore+
Assess large areas of a community quickly for how well the transportation system accommodates pedestrians and cyclists; rapidly test many different potential improvement options
Persondelay+
Gather a complete picture of how intersection operations and potential mitigation affect all users
Crosswalk+
Guide the selection of crosswalk types and possible safety countermeasures by location
Ridership+
Estimate transit ridership by station quickly; accurately forecast changes in ridership based on land use changes and transit service characteristics; perform analysis much faster and more accurately than with traditional travel models
Reliability+
Transform transit data sources into performance metrics around speed, travel time, and reliability for corridors and routes
Active+
Understand the relative utilization of street segments and intersections for walking and biking trips based on facility characteristics and adjacent land uses
MMLOS Toolkit
Consider options and best practices for assessing level of service for all modes
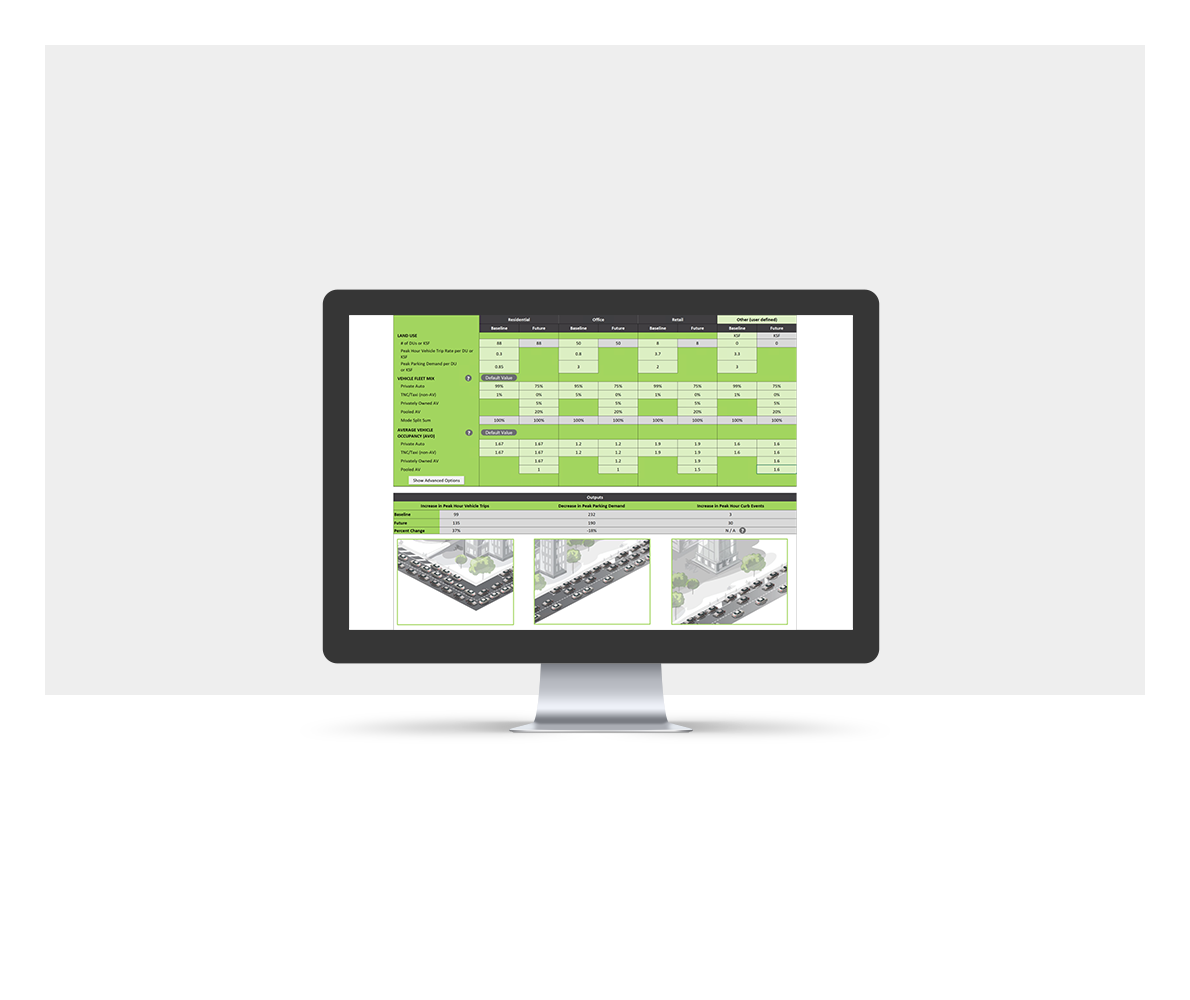
Curbspace+
Assess the highest and best use of curb space given competing needs based on number of trips likely to be served. Customizable to a specific area or street based on local observations.
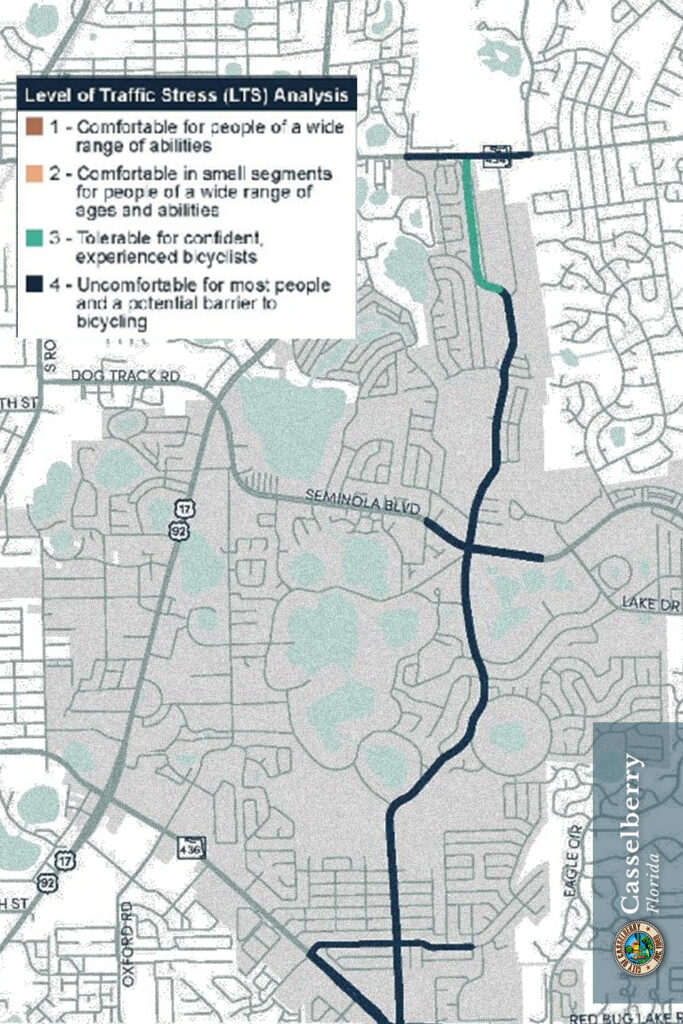
Assess large areas of a community quickly for how well the transportation system accommodates pedestrians and cyclists; rapidly test many different potential improvement options
- Uses jurisdiction or OpenStreetMap data
- Estimates appropriate pedestrian or bicycle facility based on traffic characteristics
- Can be used for equity and accessibility analysis
Estimate transit ridership by station quickly; accurately forecast changes in ridership based on land use changes and transit service characteristics; perform analysis much faster and more accurately than with traditional travel models
- Quick response
- Regression based
- More cost effective and flexible than traditional travel demand models
curbspace+
Assess the highest and best use of curb space given competing needs based on number of trips likely to be served. Customizable to a specific area or street based on local observations.
- Identify amount of curbspace needed to accommodate deliveries and passenger pickup/drop-off
- Urban-suburban center context
- Estimates private and TNC usage along with freight
- AV forecast related to parking demand, vehicle trip change, and curbspace allocation
- Used for curb management in San Francisco and transit station design in Seattle
Systems
Uniting Action Around Safety
Developing and implementing a Municipal Planning Organization Vision Zero Plan for the county in the US with the worst safety performance for pedestrians.
Achieved consensus with compelling information and transparency using:
– Safety Data Dashboard to convey complex technical information
– CrowdSource+ to gather community input during pandemic
TravelAccess+
Measure quickly how well transportation networks connect to destinations; expose potential equity limitations that may be causing difficulties for some users or geographic areas
Evac+
Evaluate the capacity, safety, and viability of evacuation routes under a range of emergency scenarios
Equity
GIS-based tool for mapping equity populations and conducting spatial analysis to discern disparate conditions for populations
Micromobility Suitability Index
Identify where transportation network and land use characteristics are favorable for deploying shared electric mobility devices (scooters and bikes)
Safety Data Dashboard
Visualize and analyze safety data in real time to help prioritize investments, prepare for grants, or answer community questions about transportation safety
TravelCast
Provide a high-level evaluation of alternative network travel routes due to construction activity
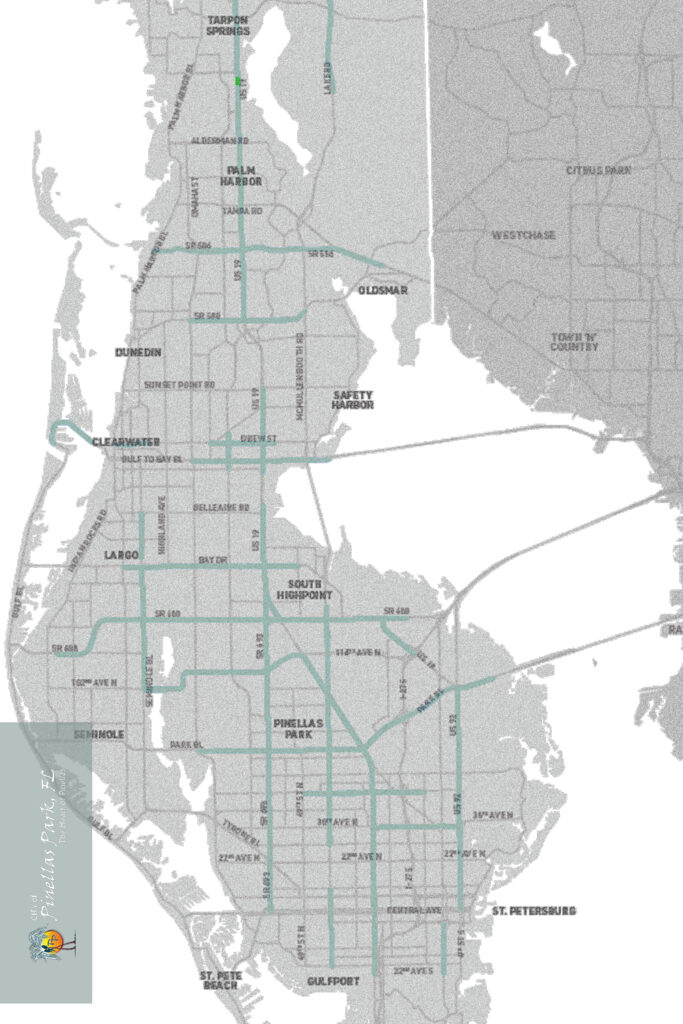
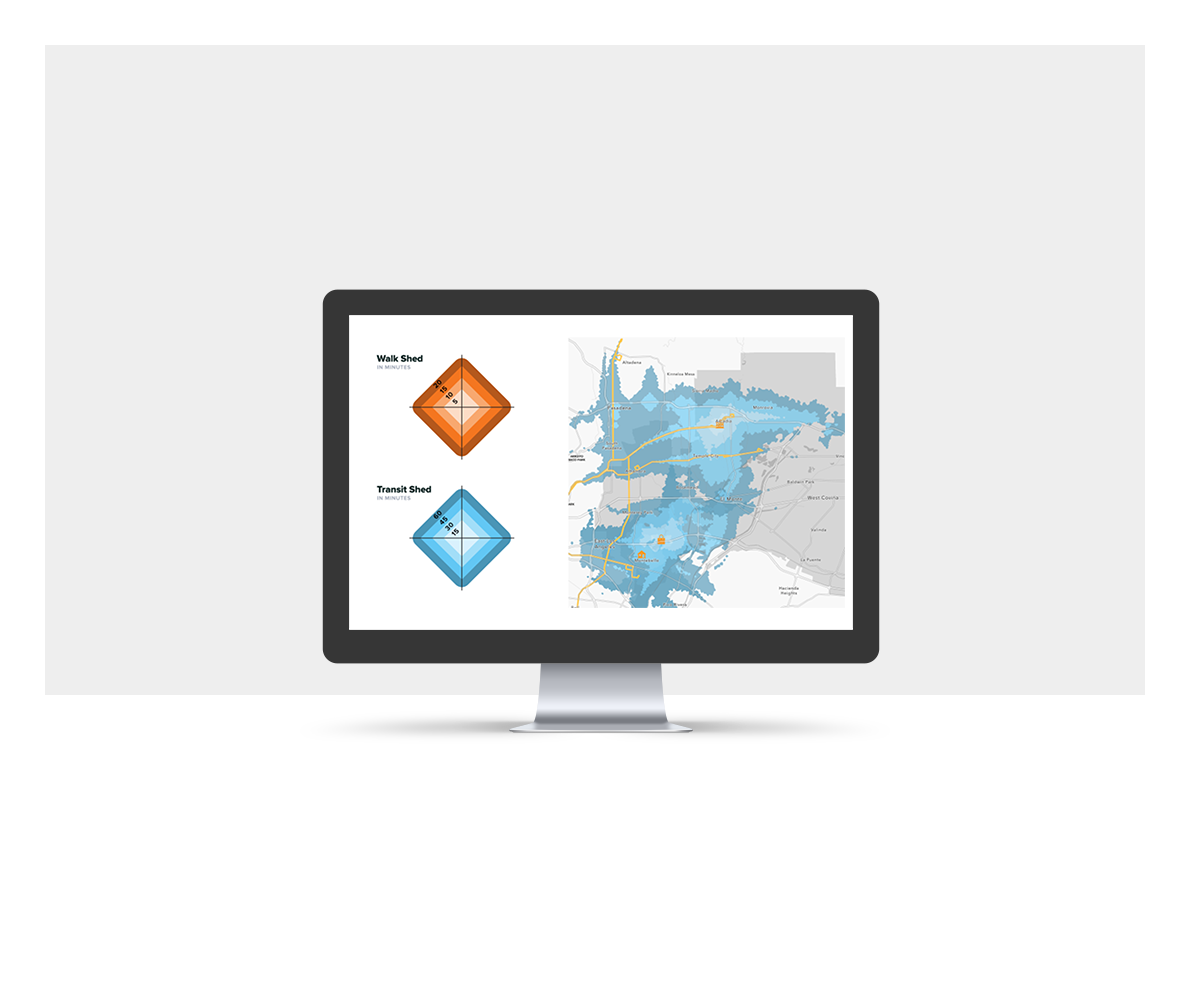
TravelAccess+
Measure quickly how well transportation networks connect to destinations; expose potential equity limitations that may be causing difficulties for some users or geographic areas
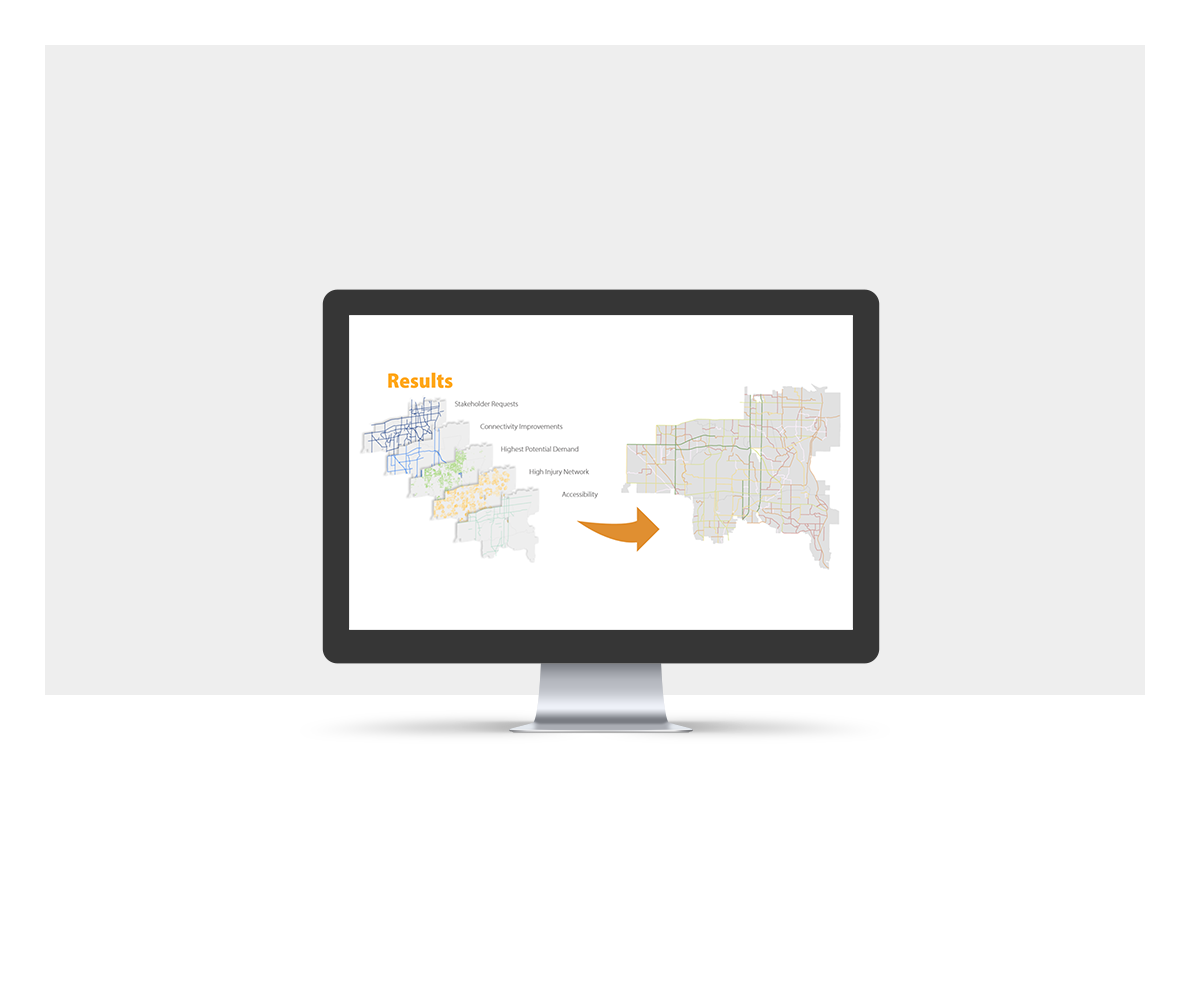
- Key challenge: How do we evaluate and prioritize an entire modal plan?
- TravelAccess+ tool rapidly tests thousands of combinations of new connections
- Includes transit routes, roadways, lower-stress walk/bike facilities, etc.
- Measures change in “access sheds”
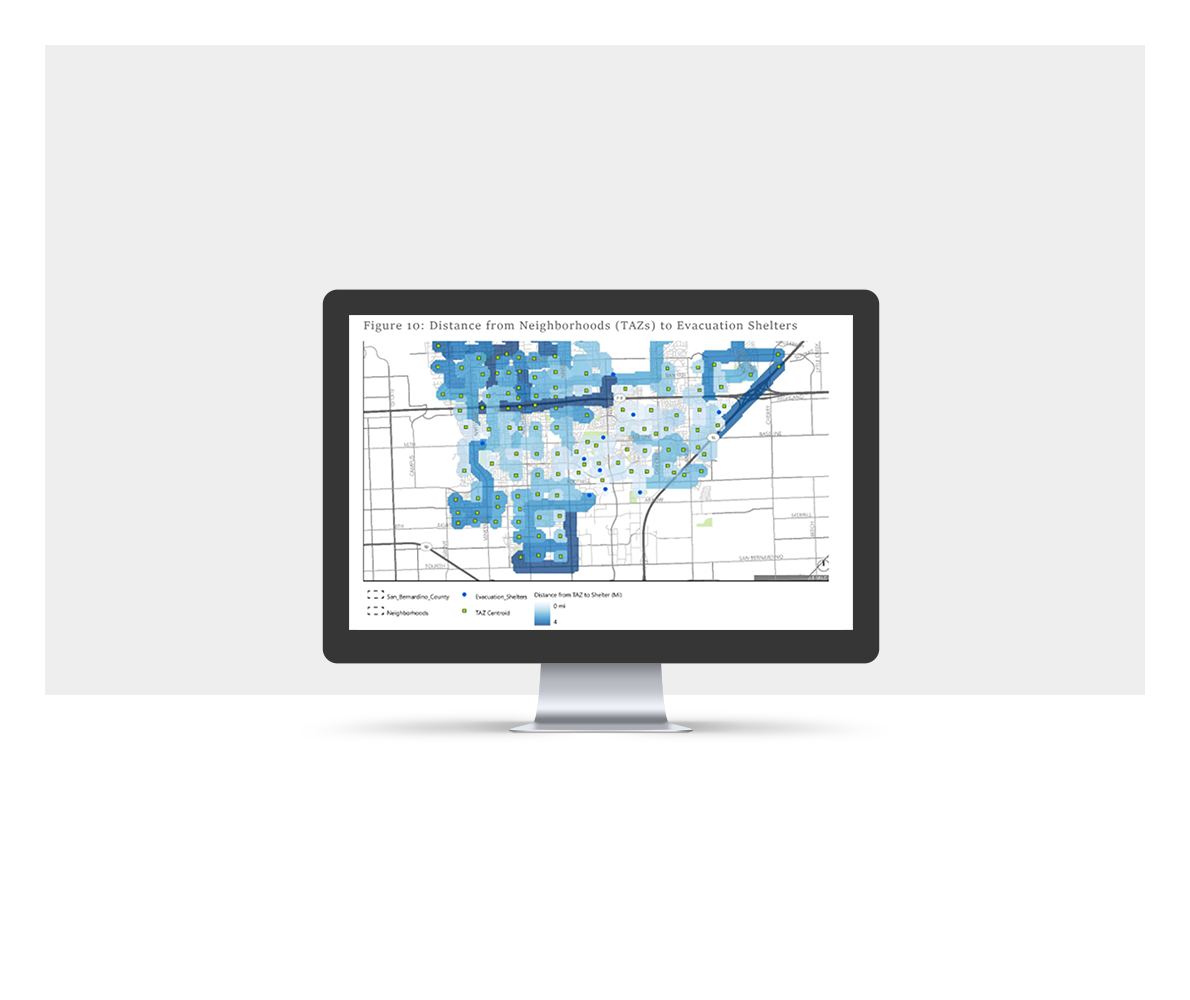
Evac+
Evaluate the capacity, safety, and viability of evacuation routes under a range of emergency scenarios
- Scalable evacuation route analysis or route resiliency analysis
- GIS and dynamic traffic assignment (DTA) versions
- Rapid scenario testing
- Customizable origin and destination points
- DTA model includes tours to pick-up family members
- Test capacity, identify bottlenecks, understand clearance times
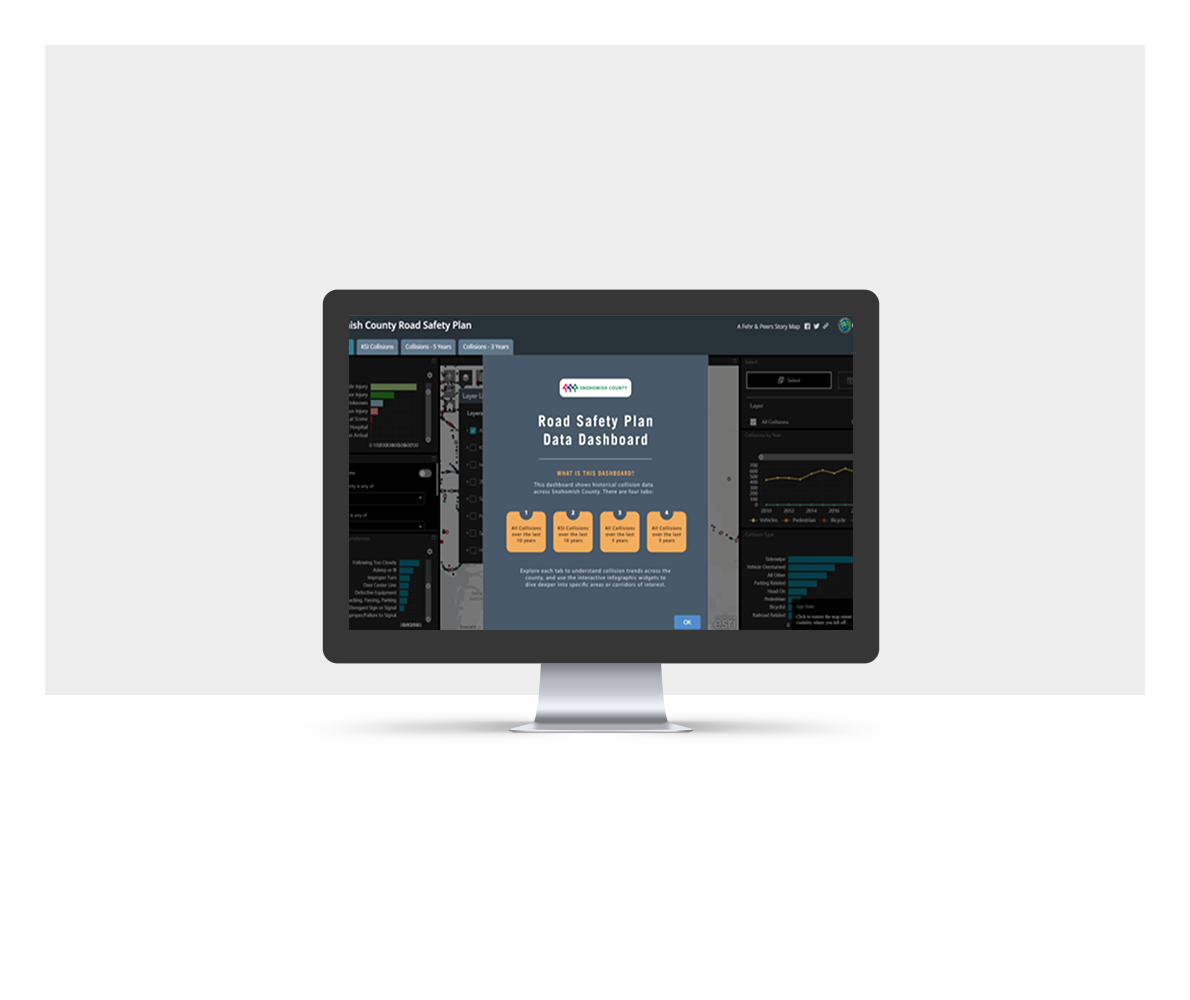
Safety Data Dashboard
Visualize and analyze safety data in real time to help prioritize investments, prepare for grants, or answer community questions about transportation safety
- Allow for dynamic summaries and analysis of safety data
- Identify trends and clusters
- Filter different types of collisions
- Powerful grant screening tool
TravelCast
Provide a high-level evaluation of alternative network travel routes due to construction activity
- Quick response assessment of construction impacts

Outreach
Managing Expectations Around Pandemic Affects
Establishing a five-year adaptable roadmap for improving service, rebuilding ridership, and helping community partners understand the long road to ridership recovery.
Desire to understand impacts of:
- Changes in commuting (especially telecommuting)
- Changes in goods and services delivery
TrendLab+ helped:
- Engage and gather input from stakeholders
- Quantify likely changes in travel demand and transit travel
TrendLab+
Forecast the effects of disruptive economic and transportation trends on vehicle miles traveled and transit use
CrowdSource+
Capture location-specific community feedback on transportation pain points, improvement suggestions, and mobility preferences
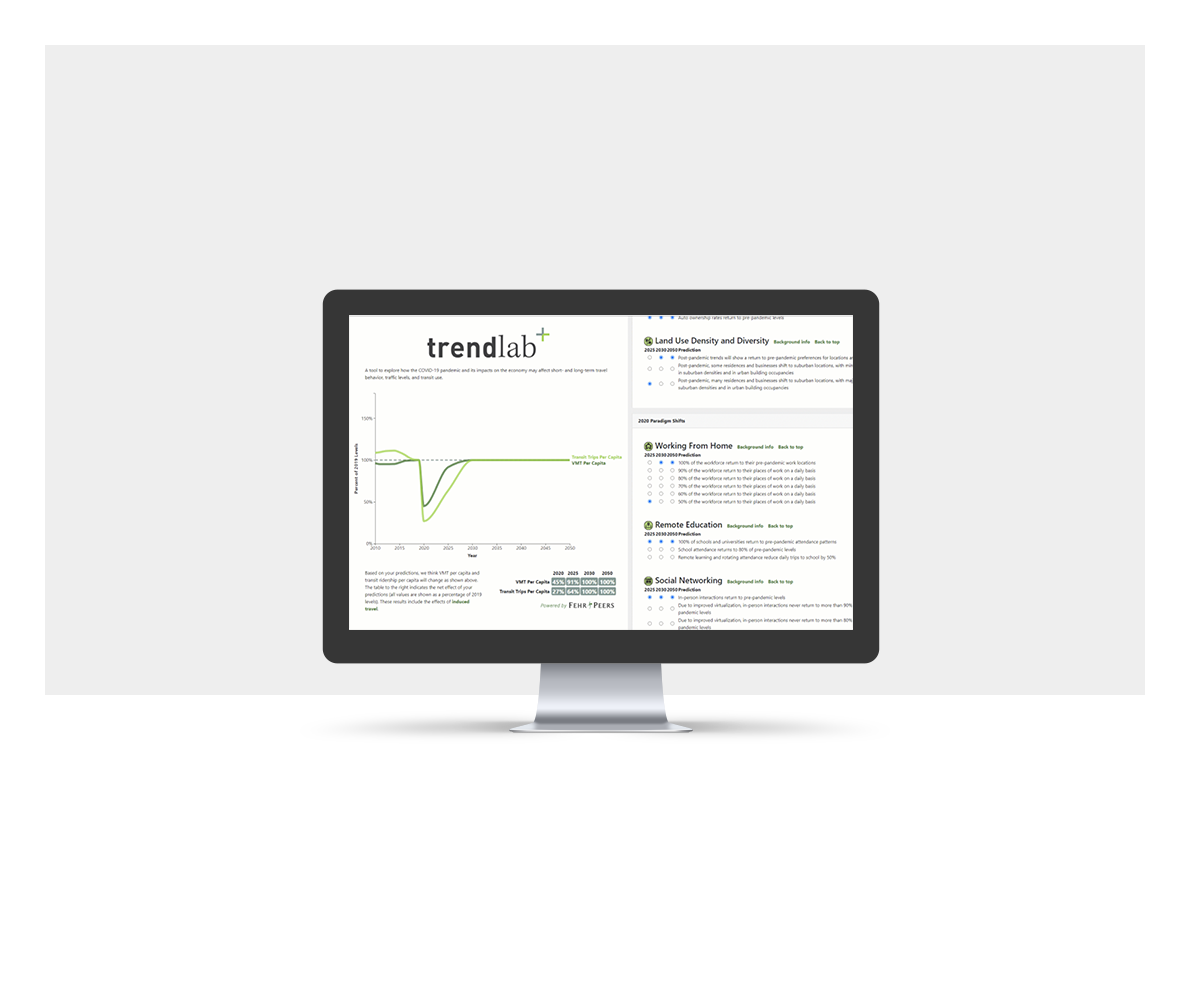
Forecast the effects of disruptive economic and transportation trends on vehicle miles traveled and transit use
- Identify implications on VMT and transit trips (soon active modes) from COVID, economic, land use, and demographic changes
- 1, 5, 10, and 25-year forecasts
- Dynamic; user-driven experience
- Rapidly test different scenarios
- Set context for more detailed analysis using other tools like travel models or multimodal simulation
Capture location-specific community feedback on transportation pain points, improvement suggestions, and mobility preferences
- Map-based community input tool
- Crowd source data and/or community concerns or opportunities
- Gather feedback, assess support for, or rank improvements
- Realtime transparent results


