
VMT Mitigation Program Implementation Flowcharts


A resource outlining the implementation steps for the VMT Bank, Exchange, and Impact Fee mitigation programs.
December 1, 2025 • 1 minute read
Woman lifting bicycle into a train as she boards

VMT Mitigation Program Implementation Flowcharts
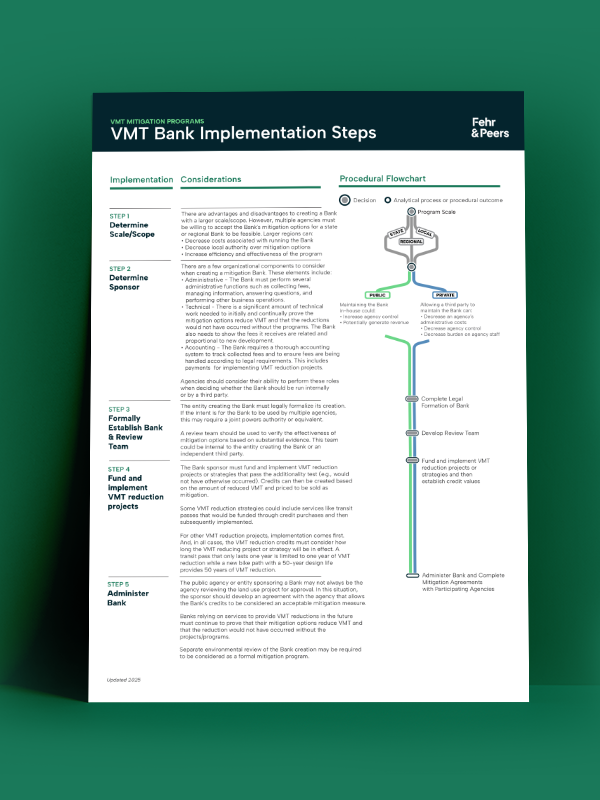
 

A resource outlining the implementation steps for the VMT Bank, Exchange, and Impact Fee mitigation programs.
December 1, 2025 • 1 minute read

This resource package helps public agencies, regional partners, and development teams compare three common VMT mitigation approaches: VMT Banks, VMT Exchanges, and VMT Impact Fee Programs.

Each flowchart breaks down key steps and considerations, including program scale, sponsorship, mitigation effectiveness, legal formation, nexus requirements, interagency agreements, environmental review, and long-term monitoring. Together, they offer a practical starting point for understanding which approach may fit a community’s needs and what it can take to move from concept to implementation.

These resources may be especially useful when agencies and development teams are exploring clearer, more consistent ways to address VMT impacts while balancing technical, legal, and administrative considerations.

share this article

Explore More

SB 743 Overview

SB 743 Overview

This overview details the advantages of using location-based services (LBS) data over traditional travel demand models, outlines the methodology for calculating VMT, and offers definitions for key metrics segmented by trip purpose and residence classification.

Visualizing VMT Per Capita

Visualizing VMT Per Capita

Our new VMT+ Tool provides a combination of resources to visualize VMT per capita at the Census Block Group level throughout California.

Section Heading Goes Here

Lorem ipsum dolor sit amet, consectetur adipiscing elit, sed do eiusmod tempor incididunt ut labore et dolore magna aliqua. Ut enim ad minim veniam, quis nostrud exercitation ullamco laboris nisi ut aliquip ex ea commodo consequat. Duis aute irure dolor in reprehenderit in voluptate velit esse cillum dolore eu fugiat nulla pariatur. Excepteur sint occaecat cupidatat non proident, sunt in culpa qui officia deserunt mollit anim id est laborum.

Subsection Heading Goes Here

Lorem ipsum dolor sit amet, consectetur adipiscing elit, sed do eiusmod tempor incididunt ut labore et dolore magna aliqua. Ut enim ad minim veniam, quis nostrud exercitation ullamco laboris nisi ut aliquip ex ea commodo consequat. Duis aute irure dolor in reprehenderit in voluptate velit esse cillum dolore eu fugiat nulla pariatur. Excepteur sint occaecat cupidatat non proident, sunt in culpa qui officia deserunt mollit anim id est laborum.

Ready to read (title of publication)? Click the button below to access.

share this article

Connect with our Contributors

First Name Last Name

Forecasting Practice Leader

AICP, PTP

Email Me

First Name Last Name

Forecasting Practice Leader

AICP, PTP

Email Me

First Name Last Name

Forecasting Practice Leader

AICP, PTP

Email Me

First Name Last Name

Forecasting Practice Leader

AICP, PTP

Email Me

First Name Last Name

Forecasting Practice Leader

AICP, PTP

Email Me

First Name Last Name

Forecasting Practice Leader

AICP, PTP

Email Me

First Name Last Name

Forecasting Practice Leader

AICP, PTP

Email Me

First Name Last Name

Forecasting Practice Leader

AICP, PTP

Email Me

First Name Last Name

Forecasting Practice Leader

AICP, PTP

Email Me

Explore More

SB 743 Overview

SB 743 Overview

This overview details the advantages of using location-based services (LBS) data over traditional travel demand models, outlines the methodology for calculating VMT, and offers definitions for key metrics segmented by trip purpose and residence classification.

Visualizing VMT Per Capita

Visualizing VMT Per Capita

Our new VMT+ Tool provides a combination of resources to visualize VMT per capita at the Census Block Group level throughout California.