
Achieving Freight Greenhouse Gas Goals

Achieving Freight Greenhouse Gas Goals

One promising strategy identified in their Blueprint, is the implementation of freight zero emission zones (ZEZs) which entail designating certain geographic areas of the city as zero emission roads for trucks or any other freight vehicles. In these zones, freight vehicles that emit GHG emissions or do not use clean energy would be charged a fee to travel on the ZEZ roads. The looming question, however, is where to start? Is there a measurable approach to achieving this ambitious GHG target?
In 2021, the city partnered with the C40 Cities Climate Leadership Group to further explore freight ZEZs. C40 includes nearly 100 world-leading cities with a primary objective of tackling climate change and driving urban action that reduces GHG emissions and climate risks while increasing urban citizens’ health, well-being, and economic opportunities. Fehr & Peers was asked to support these efforts by providing a baseline assessment of the city’s 2019 citywide-freight activity and helping the collective group better understand big data – both its capabilities and limitations to support planning for GHG reduction. From the collaborative efforts of the project team, and the integration of traffic video and big data sources, a measurable approach was defined to assess the scale of current activity and inform a plan of action to implement a strategy like freight ZEZs to reach policy and community goals.
Four Steps to Assessing Current Freight Activity
1. Develop Vehicle Typologies
- Review traffic video data and categorize vehicles based on attributes such as body type, activity type, and number of axles, to identify vehicles typically used for freight transportation
- Develop vehicle type and freight activity composition profiles for various areas in the city as each exhibit different potential conversion and GHG reduction opportunities
Helps to understand:
Current activity of different truck sizes
- Light-duty
- Medium-duty
- Heavy-duty

Percent of freight trips by vehicle type in Seattle
2. Integrate Typologies with Big Data Analysis
- Review and post-process data extracted from StreetLight
- Apply the developed vehicle type and freight activity compositions to the post-processed StreetLight data to develop population-level estimates of freight activity
- Assess metrics (per vehicle type) that inform freight activity in the area (i.e., trip counts, average trip length, vehicle miles traveled)
Helps to understand:
- How trip length differs between light-duty vs. medium vs. heavy-duty trucks
- The amount of freight activity that is local versus pass-through
- Where freight vehicles are going to/coming from
- The fraction of freight trips that are within a city or from one city to another

Average daily freight trip activity distribution in Seattle by vehicle type
3. Define a “Day in the Life” of a Delivery Truck
- Focus on a freight activity hotspot identified from big data analysis and integration
- Utilize UberMedia data to trace typical trip patterns of delivery trucks (related insights on trip patterns help inform utility infrastructure planning)
Helps to understand:
Typical trip patterns of delivery trucks

Example of daily delivery vehicle tours in Seattle indicating the City will need to partner with delivery companies to advance electrification
4. Identify Gaps to Explore Further
What additional considerations would be valuable to consider for each GHG reduction strategy? For example:
- Examine curb use to illustrate the scale of unmarked passenger vehicles use for freight deliveries
- In the case of Seattle, as potential locations are identified for freight ZEZs, it will be important for them to consider reviewing with an equity lens at possible impacts from different scenarios (e.g., designing a freight ZEZ in an area with high freight activity would be the most impactful, but how do you do that discreetly in areas of high pass through to mitigate burdens on already-affected communities and maximize the benefits?)
Helps to understand:
Full impact of freight and delivery services
This study to gather a solid baseline of freight activity sets the stage for the next steps in Seattle’s planning efforts, including community outreach to share freight insights and solicit feedback and input on freight ZEZs. One of the goals of this case study is to enable other cities in the C40 Zero Emission Freight network to learn from Seattle’s experience. Therefore, the study results were shared with city peers at the “North American Cities’ Deep Dive” event organized by C40 in June 2021. Other cities with similar goals can replicate this approach and utilize it to understand the effects of supply chain disruptions. As the flexibility and processing time of big data increases, coupled with the recent availability of truck size information, more cities are able to quickly understand their freight activity and identify suitable areas for freight ZEZs. Having a measurable approach can help cities justify their policy decisions, which is critical when applying for future grant/funding opportunities to implement freight ZEZs and supporting advancements in equity for the communities they serve.
“The analysis was excellent in exploring “big-data” opportunities to gather more and better data related to freight mobility and freight traffic flow”
Principal Planner, Seattle Department of Transportation, City of Seattle
share this article
Explore More
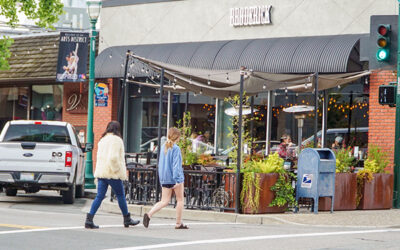
Coordinating the Curb, Not Just Reacting to It
Walnut Creek’s curbside management plan took them from reactive fixes to a more coordinated, goal-driven framework for their suburban downtown. Here’s what changed, and what other agencies can learn from it.
Rethinking Street Design for Safety and Emergency Access
This February 2026 ITE Journal article shows how connected street networks and cross-department collaboration can help communities balance everyday safety with reliable emergency access.
Deepening Our Commitment to Safer Streets Nationwide
We’re excited to share that Safe Streets Research + Consulting is now part of Fehr & Peers.