

Every year, tens of thousands of people in the US are killed in traffic crashes. Communities have spent decades working to make those crashes less severe and less likely to happen. But a new body of research is asking a harder question: what if it’s being looked at backwards?
Conflict management and speed management are strategies that save lives, and they remain essential. But they share a common limitation: they treat the volume of driving in a system as a given, and work within it.
What if reducing that volume is itself a safety strategy?
A study published this month in Injury Prevention, co-authored by Principal Meghan Mitman, analyzed 227 urban areas across 45 states, controlling for speed, enforcement, demographics, and socioeconomic conditions. The strongest predictors of traffic fatality rates weren’t any of those factors. They were automobile mode share, vehicle miles traveled (VMT), and time spent in the transportation system. And that held for drivers, pedestrians, and cyclists alike.
The finding reframes what counts as a safety intervention. A transit corridor that draws trips off a parallel arterial isn’t just a mobility investment: it reduces the total kinetic energy in the system before any crash has a chance to occur. Affordable housing near jobs doesn’t just address cost burden: it shortens trips and reduces driving for the households that need relief most. Mixed-use development, connected pedestrian and bike networks, congestion pricing: these aren’t adjacent to Vision Zero. They are Vision Zero, operating upstream of where most safety programs begin.
This is the exposure lever, the third component of kinetic energy risk that our Safety Multipliers framework has been building toward. What this research adds is peer-reviewed evidence, across 227 urban areas, that it may be the most powerful lever available.
The research also reminds us who bears the most risk. Across every model, lower income was a consistently strong predictor of higher fatality rates. For people walking, race and ethnicity mattered too. It reflects something most planners already sense in the field: the highest-exposure, highest-risk roadways are rarely in the neighborhoods with the most resources to change them. Addressing exposure equitably means starting where that compounding disadvantage is greatest.
The tools to act on these findings are already here. General plans, transportation impact analyses for land use projects, and corridor studies each shape the exposure conditions that determine safety outcomes for decades.
If you’re working on a Vision Zero plan, a general plan update, or a corridor study, we’d love to think through what this means for your community.
share this article
Connect with our Contributor

Explore More
Inside Our Summer Intern Program
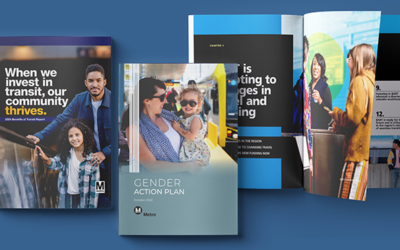
Turning Data into Transit Currency
See how three U.S. cities are using data-driven storytelling to connect transit to daily life, reshaping it into something people want to ride and invest in.

Olympic-Size Mobility
Olympic fever fills the air as Paris hosts the 2024 Games, welcoming millions of visitors. Meanwhile, Los Angeles gears up for the 2028 Olympics, focusing on improvements that will benefit the city long after the games end.