
Big Data and Transportation: From Questions to Confidence

Big Data and Transportation: From Questions to Confidence
Big data isn’t new. Cities collect it, vendors sell it, and planners talk about it constantly.
But in practice, transportation planning with data is less about having more information and more about understanding how to use it effectively. Across the country, city leaders are asking similar things:
How do we use the data we already have? Which sources can we trust? How do we explain what it all means?
These aren’t just technical questions. They’re questions of leadership and decision making.
Hermosa Beach, California, is one example of a city thinking bigger. They’ve moved from one-off analyses to a consistent, long-term approach for using transportation data to understand and explain change.
To make it happen, we started with something many cities struggle with—making sense of the information already at their fingertips.
Managing Existing Data
Cities often collect far more data than they can easily use. Without a clear structure, it can sit on a virtual shelf, hard to compare, update, or share.
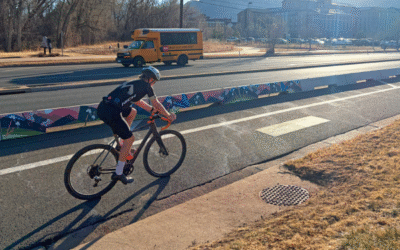
That was the challenge for the City of Hermosa Beach when they added new bike lanes to arterial streets in the popular downtown area.

Portion of Hermosa Avenue modified to include bike lanes
Photo credit: City of Hermosa Beach, California
“We had plenty of data, but sorting through it was a challenge,” said Krauss. “We needed to figure out what to focus on, build processes we could repeat, and make sure the data could inform future priorities.”
Together, we built a framework to organize, validate, and apply the City’s existing information—nearly six years of vehicle, bike, and pedestrian counts spread across hundreds of Excel files and dozens of distinct segment-level and citywide analyses—in a way that supported ongoing monitoring.
Consistency became the foundation, collecting data in the same way, in the same places, over time, so results could be meaningfully compared.
Choosing Datasets That Matter
Now that Hermosa Beach’s data was organized and validated, it was ready to put to use when needed—like to see what was happening on the ground when the City reallocated a travel lane to a bike lane on two major downtown arterials.
“Some people worried that the new bike lanes might be pushing traffic into nearby neighborhoods, potentially being a source for more congestion, noise, and hazards,” said Krauss. “Their concerns were valid and taken seriously, so we wanted to see if the data reflected the same thing.”

Map of Downtown Hermosa Beach with modified and monitored streets
To understand how travel patterns were shifting, we blended traditional traffic counts, video detection, field observations, and big data from multiple sources.
Every year, new data platforms enter the market—StreetLight Data, Replica, INRIX, Geotab, and many others. Each offers cutting-edge insights, but none tell the full story on their own. The key isn’t tracking every vendor or product update. It’s clarifying the question first, then identifying the dataset that could best support the answer.
“The challenge wasn’t a lack of data. It was choosing the right sources and explaining what they actually meant,” said Krauss.
In this case, StreetLight Data provided cost-effective regional context through the City’s MPO membership, with route-level analytics that added another dimension not often available in traditional counts.
While StreetLight Data helped us understand overall traffic patterns, it didn’t include the most recent months. To fill the gap, we incorporated Azira data, a complementary location-based service data vendor.
While the datasets didn’t align perfectly, trends across the datasets still pointed in the same direction and were validated against ground counts and field observations for confirmation.
Building Confidence Through Monitoring
“Ultimately the data showed that overall traffic patterns were stable along neighborhood routes, with modest fluctuations. Additionally, both walking and biking had increased in downtown. We felt much more confident once we had multiple, validated data sources over multiple years showing these results,” explained Krauss.
These combined insights allowed the City to track performance over time and identify clear trends in neighborhoods and downtown travel activity.
Downtown Route Distribution
This first graph shows how people traveling to and from downtown used major roads or neighborhood streets before and after 2021.

Downtown Walking and Bicycling Activity
This next graph shows changes in walking and biking activity since 2021.

This yearly cycle of checking, visualizing, and refining data has become the City’s foundation for producing useful and credible insights.
Explaining Findings Clearly
People are more likely to trust data when they can understand it.
“Your average person doesn’t want to read a technical report—they just want to know how safe or congested their streets are,” said Krauss.

Photo credit: City of Hermosa Beach, California
Together, we created clear before-and-after visuals to show changes in travel behavior. Summaries followed a consistent format and were shared with officials and the public through City Council staff reports, creating transparency and continuity over time.
“Since these bike lanes were added, we’ve continued collecting data in the same way each year,” said Krauss. “Being intentional and transparent is important to us.”
The Takeaway
Hermosa Beach’s approach shows how cities can move from one-time studies to continuous performance monitoring, making data both useful and trustworthy.
When cities and agencies organize what they already have, choose datasets intentionally, and validate across multiple sources, they build a lasting foundation for confident decisions and transparent communication.
Because the goal isn’t just to collect more data. It’s to understand what’s happening today, track how it changes tomorrow, and keep learning over time.
We’re constantly exploring new ways to gain useful insights from data. Please reach out to our team if you need help in this area!
share this article
Contributors

Sean Reseigh
Fehr & Peers
Email Me

Mike Wallace
Fehr & Peers
Email Me

Dylan Di
Engineer/Planner
Fehr & Peers
Email Me

Douglas Krauss
Environmental Programs Manager
City of Hermosa Beach
Explore More
Deepening Our Commitment to Safer Streets Nationwide
We’re excited to share that Safe Streets Research + Consulting is now part of Fehr & Peers.
Evolution of Quick-Build Bikeways
Quick-build projects have come a long way from their paint-and-plastic beginnings. Our Toolbox gives public agencies a practical way to compare quick-build materials for bikeways that balance budgets, timelines, durability, and aesthetics.
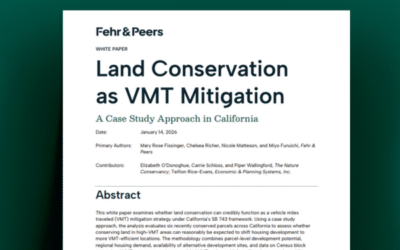
Stacking Benefits: The Role of Land Conservation in VMT Mitigation
What six California case studies reveal about how conservation might reduce driving, and when it might not.