
Announcing Safety Multipliers

Originally published May 18, 2026. Updated to include links to published Safe System Institutionalization Toolkit and Safe System Success Stories.
Two collections of Safe System case studies are landing this summer. The Insurance Institute for Highway Safety, in partnership with the University of North Carolina Highway Safety Research Center, the Institute of Transportation Engineers, the Vision Zero Network, SafeTREC at UC Berkeley, and Fehr & Peers as a co-sponsor, will release a compendium of Safe System case studies at the ITE International Conference in Detroit (now available here). A second collection appears in the NCHRP 08-171 Safe System Institutionalization Toolkit, releasing in June (now available here). Both efforts trace projects that have measurably reduced crash injury risk through the three levers of the Safe System Approach: exposure, severity, and likelihood.
Working on these case studies clarified something we have been seeing in our own projects for a while. The cases that produced the most durable safety gains were not the ones that pulled the hardest on a single lever. They were the ones where an intervention package pulled all three at once, with each component making the others work harder.
We are calling that pattern a safety multiplier. San Francisco’s Van Ness BRT is a useful example: a transit-only lane that simultaneously reduced vehicle volumes, slowed remaining traffic, removed conflict points, and improved emergency response. One project, multiple wins reinforcing each other.
We have put together a page that explains the multiplier concept, walks through Van Ness to illustrate it, and catalogs eleven other multipliers we have been tracking such as congestion pricing, road diet or road reconfiguration packages, Safe Wave signal timing, Safe Routes to School networks, and others. It includes a quick-reference table showing which lever each one emphasizes, so a decision maker can select from the best fitting ideas for their local context.
share this article
Connect with our Contributors


Explore More
Announcing Our CEO Transition
Fehr & Peers is pleased to announce a CEO transition. Chris Mitchell assumes the role this month, with 20 years of firm leadership. He succeeds Matt Henry, who served 15+ years as CEO. We’re grateful for our success under Matt’s leadership, and are excited for the next phase.
Partnering from Concept to Construction
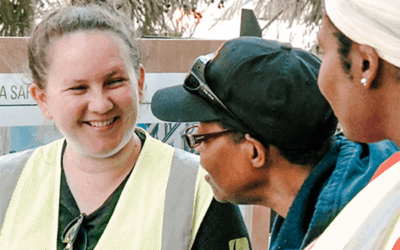
With a passion for bringing transportation concepts into reality, we partner with our clients on many projects from initial plans and prioritization through to construction. Learn how we worked to integrate complete streets solutions in Honolulu, Hawaii from concept all the way through implementation.
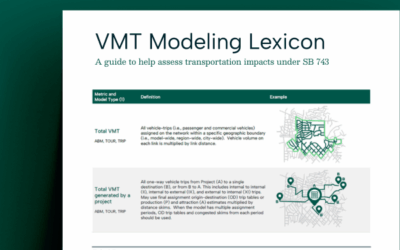
Understanding VMT Metrics: Explore Our Modeling Lexicon
CEQA’s July 1 deadline is swiftly approaching, making it increasingly important to be able to understand and navigate all types of VMT calculations. Our new quick-reference VMT lexicon makes that easier. Explore it now here.