Find Your VMT With VMT+

A Tool to Support California Transportation Planning

Planners are often required to estimate increases or decreases in driving to help describe the consequences of land use and transportation network decisions. Understanding the amount of vehicle miles traveled, or VMT, generated by a community provides a clearer picture of how integrated their transportation network is with existing land uses and offers insight to the experience of all people traveling.
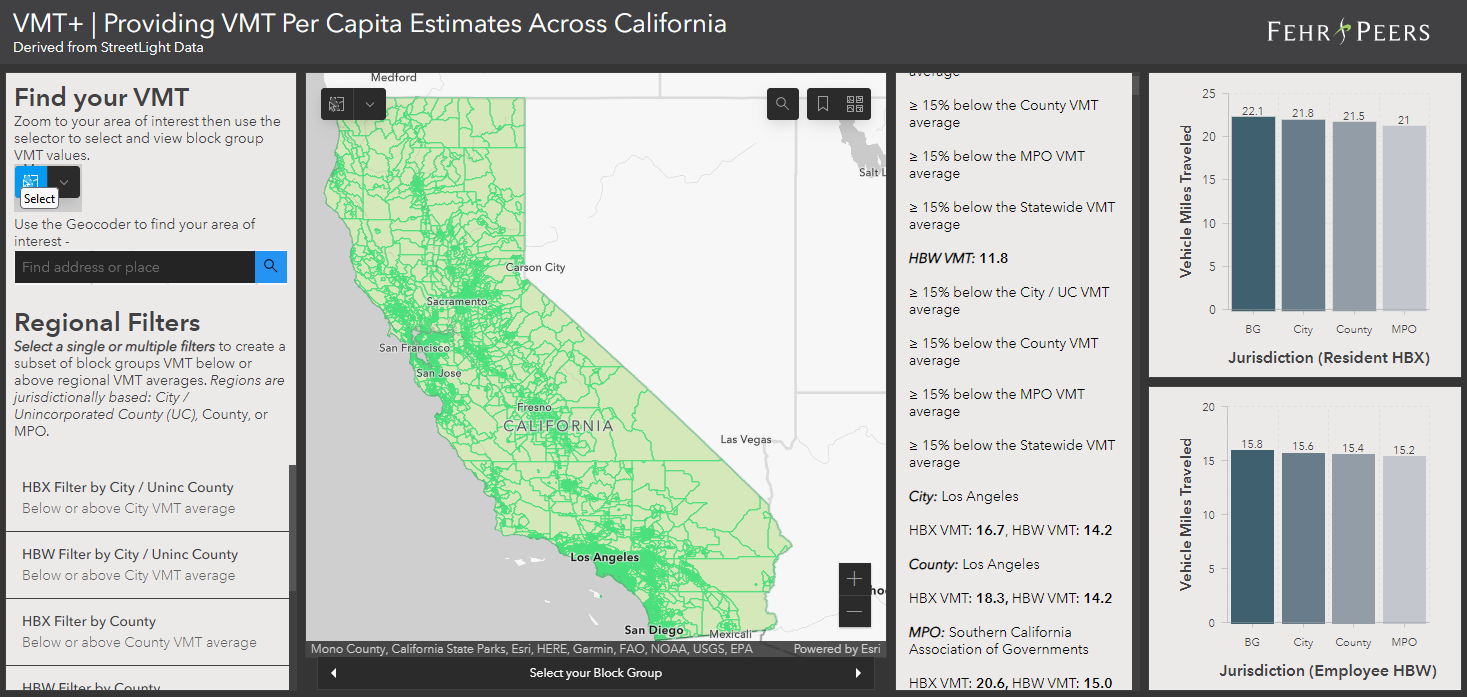
Many states are beginning to estimate changes in VMT associated with land use and transportation projects as part of a project’s evaluation. Frequently, these analyses of VMT require use of local and regional travel demand models, which may not represent current conditions, complete trip lengths, or unique land uses, and can also be time-consuming to operate. VMT+ provides recent estimates based on observed travel conditions with the capability of comparing VMT per capita across regions and the entire state, equipping planners with much more robust and reliable data. Find your VMT below.

Open VMT+ in Browser →

This dashboard allows you to quickly compare two types of VMT for each Block Group to the local, regional, and statewide VMT averages. For more advanced analysis, select, filter, and compare VMT across cities, counties, unincorporated areas, MPOs, and the state.

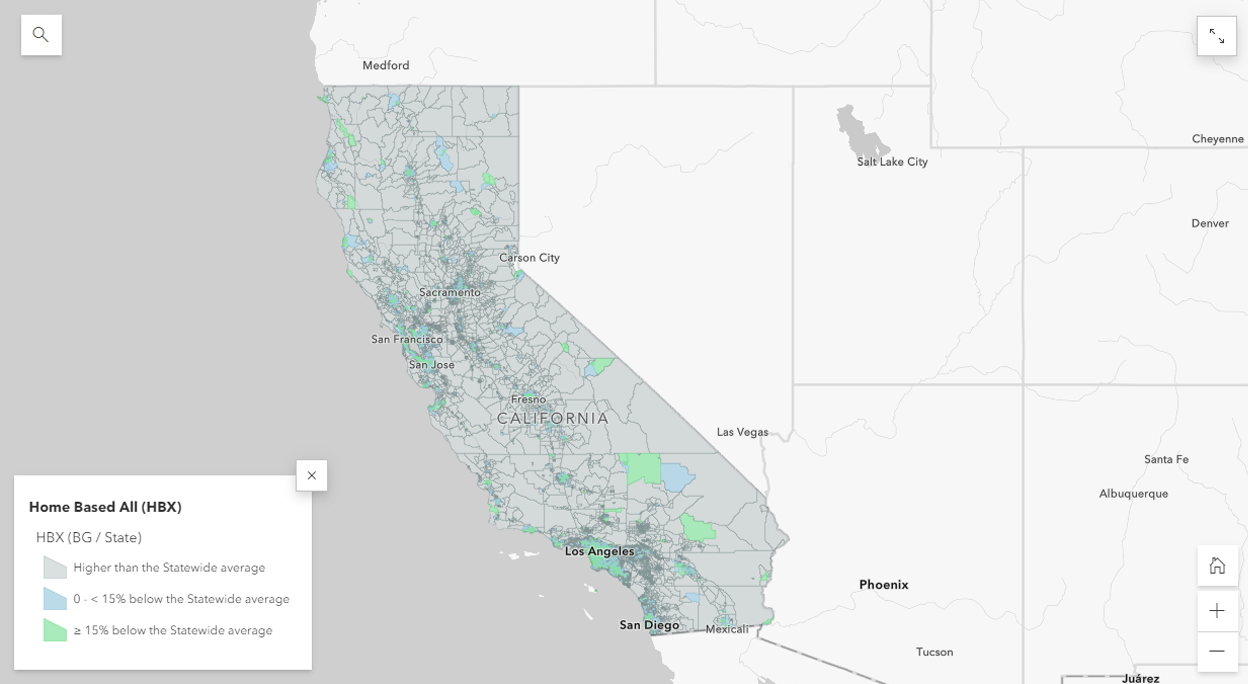
Home-based VMT per resident

How many vehicle-miles are driven per person living in the Census Block Group to and from their homes each day? This estimate considers all types of trips, and the statewide average is 21 vehicle-miles per person.

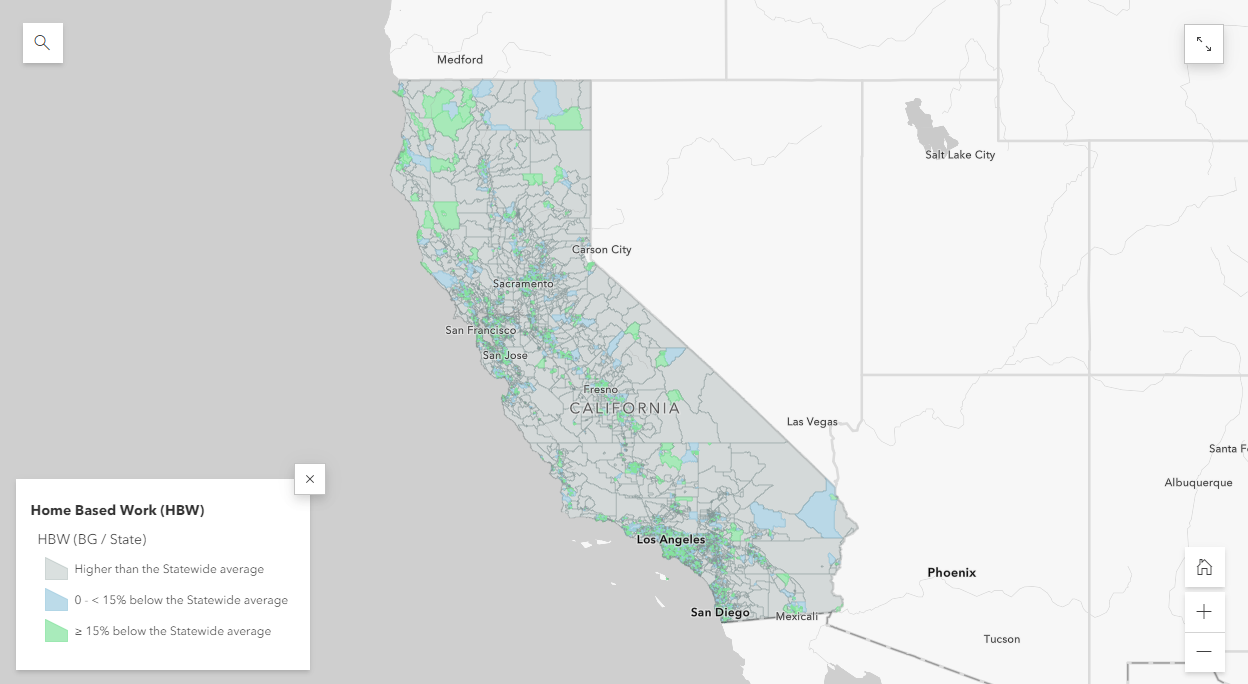
Home-based work VMT per worker

How many vehicle-miles are driven to and from work each day per person working in the Census Block Group? This estimate considers only trips to and from work, and the statewide average is 15 vehicle-miles per person.

Other Applications

CEQA & VMT ANALYSIS

Grant & FUNDING APPLICATIONS

land use assessments

walk score validation

greenhouse gas analysis

About the Data

Fehr & Peers derived VMT estimates from a custom application of StreetLight Data. We used sample trip estimates from March through May of 2019. We will also be offering 2022 data between March and May as part of our consulting services. Contact us to learn how you can apply these data in your projects.

While we hope these VMT estimates simplify and enhance your planning process, Fehr & Peers makes no warranty regarding the data’s accuracy, quality, or appropriate use. This data set is intended to complement other VMT data sources, such as regional or local travel demand models. Since the VMT estimates are new and have not been fully validated or peer reviewed, the data is offered as-is and should be thoroughly reviewed for reasonableness in any applications. We welcome all suggestions for improving the data or tool.

Contributors

Mike Wallace

Mike Wallace

Forecasting Practice Leader

Ron Milam

Ron Milam

Forecasting Practice Leader

Patrick McDonough

Patrick McDonough

Database Engineer

VMT+ is a project of Fehr & Peers Research & Development.
Data provided by StreetLight Data.