
What are TNCs Share of VMT?
As transportation enthusiasts, the explosion of mobility options the past few years has been fun to see. We’re proud of the role we’ve played during these times, providing objective analysis and partnering with our clients and communities to navigate new waters. When Lyft and Uber (TNCs) came to us with a question — What are TNCs’ share of VMT? — we jumped at the opportunity; not only to help valued clients, but also to add to the dialogue about mobility and cities.
Our team determined the “when” and “where.”
The question is straightforward, but it only covers “who” and “what.” The “when” and “where” were determined by our team. After discussing too many analysis parameters to list, we settled on our extents: six metro areas to provide national coverage studied during a single month. Our aim was to not be too zoomed in to miss the big picture, but not too zoomed out to provide insight.
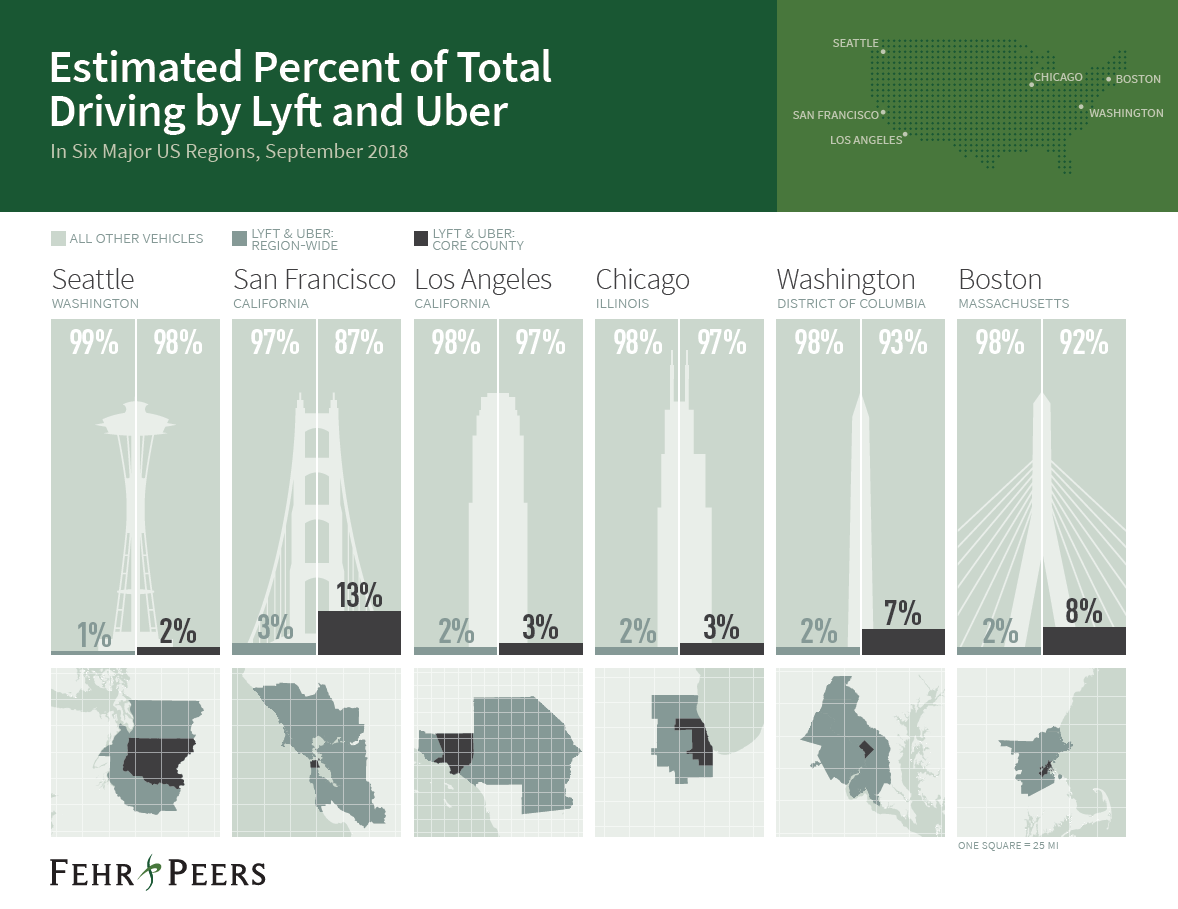
What is the estimated percent of total driving?
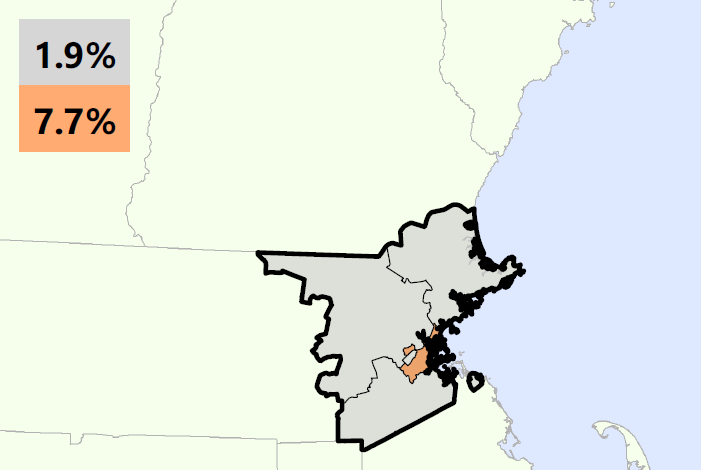
You can see the topline results to the right. In September 2018, TNCs accounted for approximately 1 – 3 percent of total VMT in the six metro regions, with the balance of VMT generated by other sources, such as passenger and commercial vehicles. When looking solely at the core county of each region, the share of TNC VMT is approximately 2 – 13 percent, with King County in Seattle representing the least and San Francisco County representing the most.
Explore the analysis.
Learn more by contacting one of our industry experts.
Quick Links
© 2017 – 2024 Fehr & Peers. All rights reserved.