Six Big Questions Clients Are Asking About Transportation and the Pandemic
1. When and how will workers return to the office?
Many Bay Area residents who have been working from home are starting to or thinking about returning. What will they find when they do? Will wide-open buses and train cars entice them back, or will they turn to commuting by car for convenience—or for social distancing?
Meanwhile, of course, many workers continued to commute and work in person. In what ways have the activity patterns of these essential workers evolved throughout the pandemic? How well have transportation systems served the needs of these travelers?
As remote workers return to the office, transit agencies may become poised for an opportunity to shape new habits for these travelers. Will the gap in commuter transit use over such a long period mark a longer-term erosion of transit habits? What opportunities and threats might this present for agencies? Lower peak-period ridership could support a more level all-day service pattern, with cost savings and equity benefits in play. It could also lead to a vicious cycle of reduced revenue, service, and ridership.
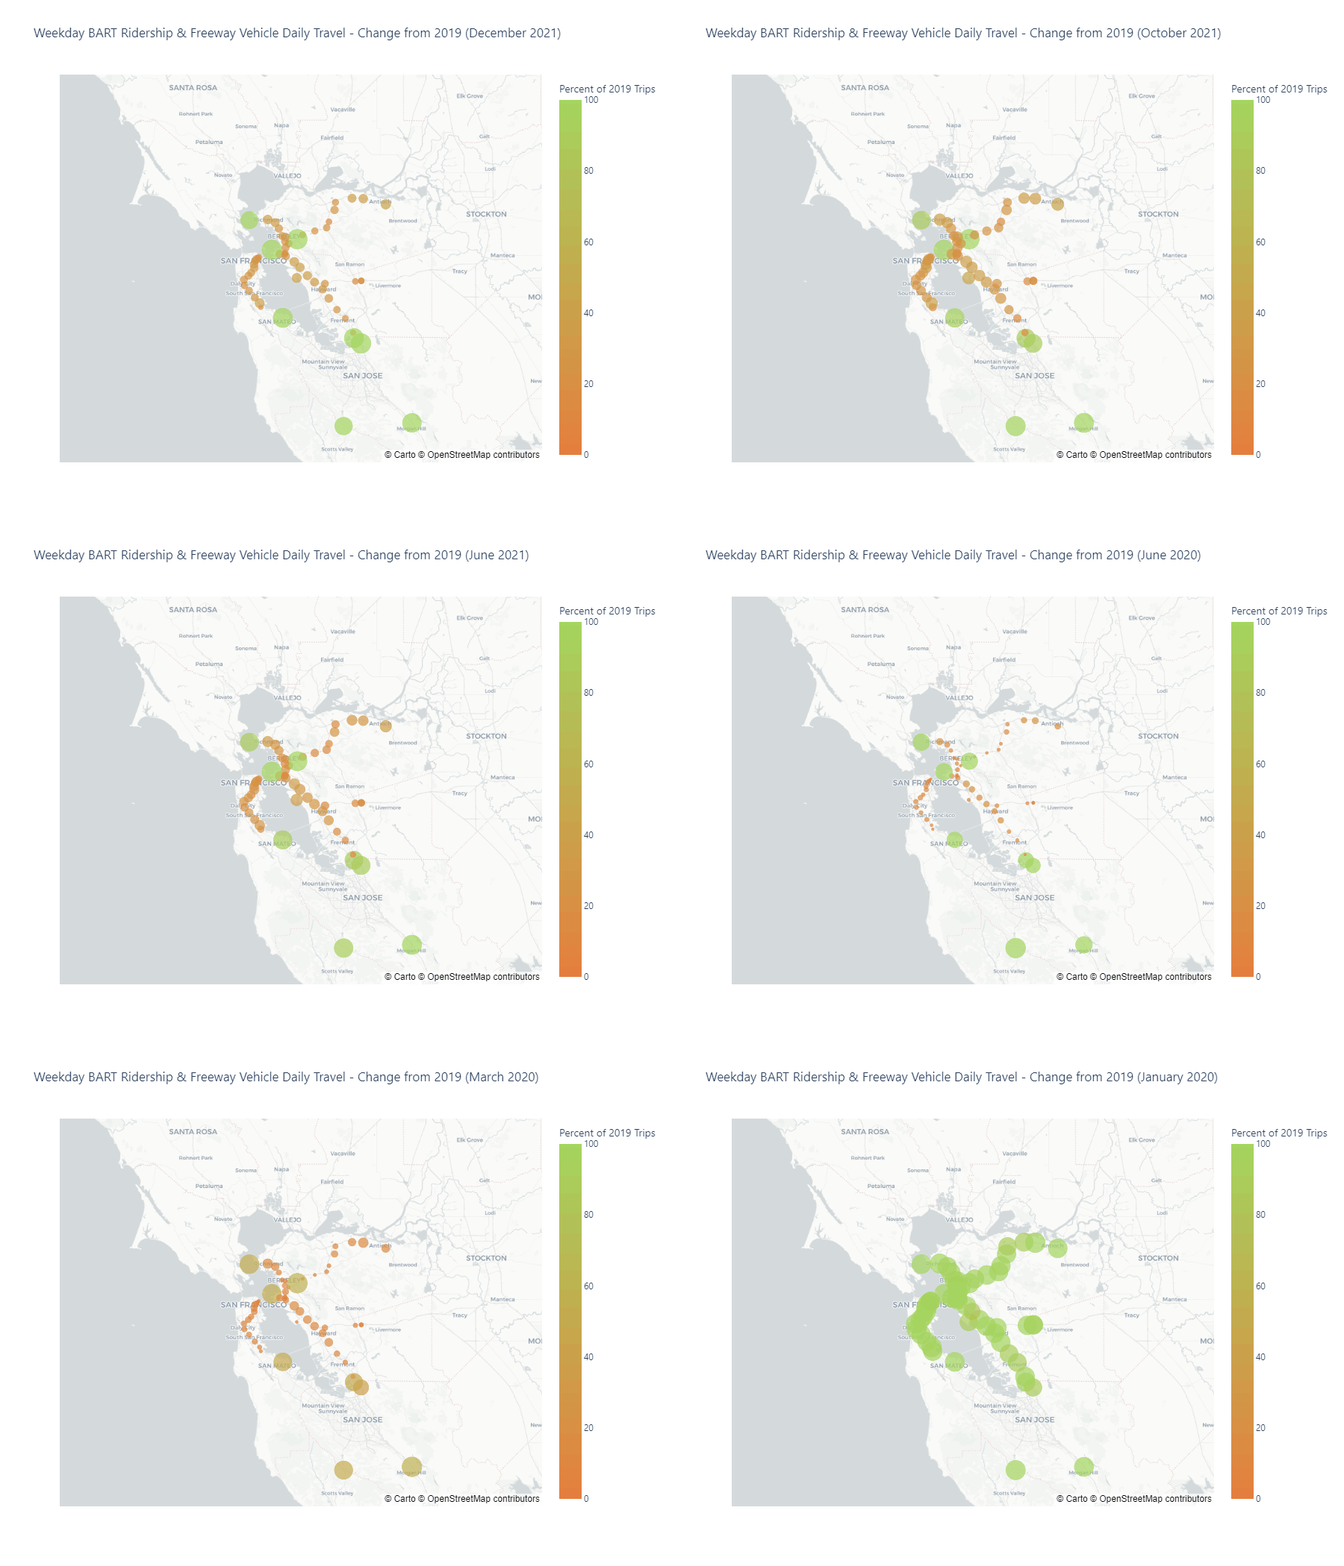
Below, you can see how BART ridership and freeway traffic volumes have changed over time and across the Bay Area. Transit and driving both dropped sharply in March 2020, but vehicle volumes have tended to recover more and sooner than transit ridership.
2. What is the current state of travel in the Bay Area? Where will it go next?
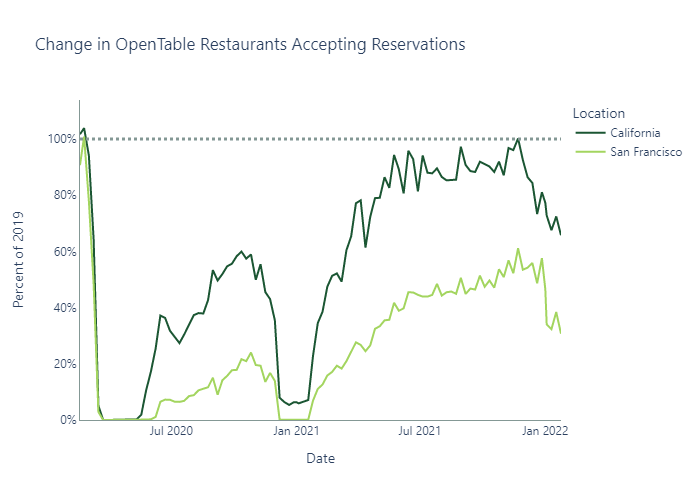
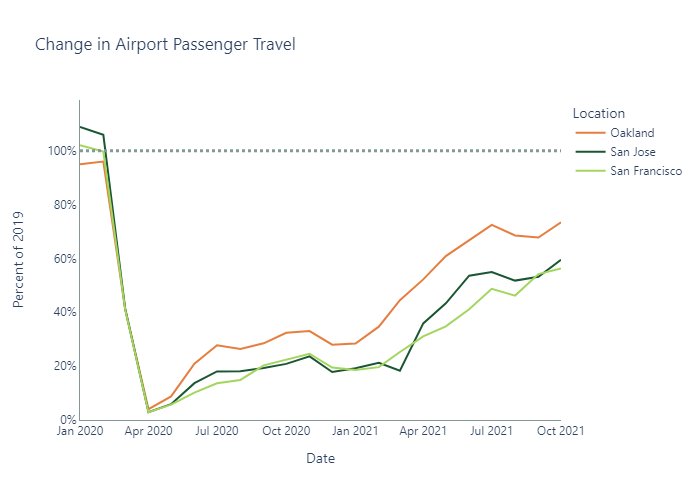
Fehr & Peers has closely tracked Bay Area travel trends throughout the pandemic. Our metrics include transit agency ridership across the region, Big Data estimates of vehicle travel, commercial indicators (such as restaurant bookings), and micromobility services (such as Bay Wheels).
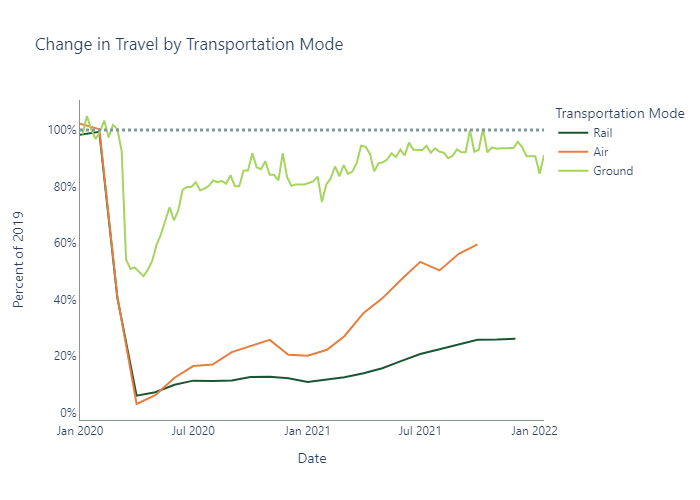
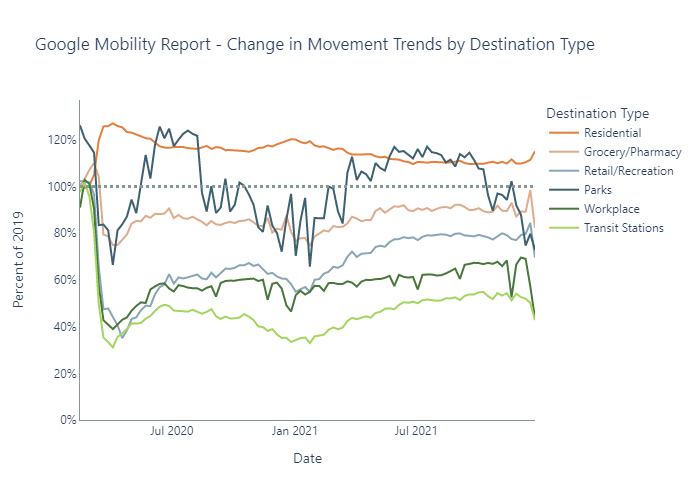
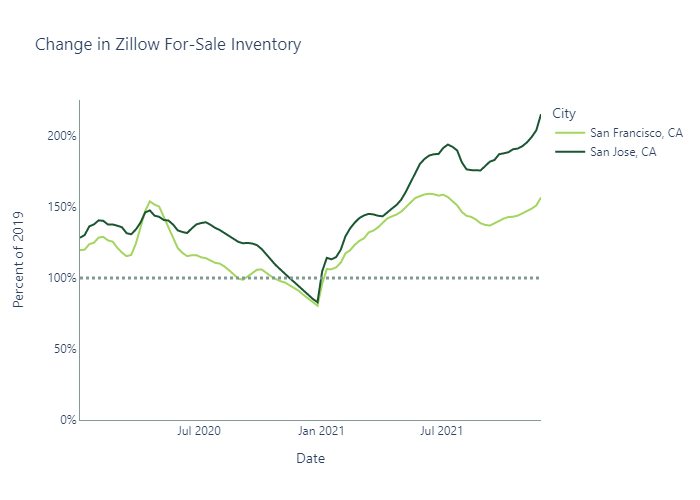
The trends below show an uneven recovery. On many freeways across the Bay Area, vehicle volumes are already at or near their 2019 levels. Meanwhile, airport passenger traffic is down 30% or more, weekday BART ridership is down 75% (!), and restaurant reservations and real estate listings reveal a complicated picture of halting efforts toward normalcy and moments of extraordinary supply and demand constraints.
A clear picture of the evolution up until now is not sufficient. Our considerations include medium-term and long-term potential futures using tools such as TrendLab+, and we have created up-to-date guidance for our clients on how to proceed now for projects that will unfold over the coming years. For example, should project sponsors still use 2019-era data as their California Environmental Quality Act (CEQA) baseline, or have we reached the point where current conditions become more appropriate? We can help play out multiple scenarios to assist in the futureproofing of projects today and to bolster the defensibility of environmental documentation.
3. What are the equity implications of these changes?
Surveys of Bay Area commuters conducted in 2021 indicated that about 1/3 of workers who commuted five days a week before the pandemic expect to commute less after the pandemic. Responses also show that the greatest share of workers who would commute less expect to work three days a week. Income factors significantly into the ability to work from home. A Bay Area Council survey indicated that the share of workers who say they will commute into the workplace fewer days after the pandemic is 47% for workers making more than $150k, but only 22% for workers making less than $100k. BART has estimated it may take years to recover their ridership, with higher-income riders who drive and park at higher rates making up a larger share of lost riders, compared to low-income riders that walk, bike, and bus to BART stations at higher rates.
During the pandemic, several transit agencies made substantive changes to better serve transit-dependent residents and essential workers. Motivated by the results of an equity assessment prepared by Fehr & Peers, Caltrain implemented a new schedule emphasizing the improvement of service for essential workers and low-income riders that provided regular, half-hourly service at major stations all day on weekdays, emphasized timed connections to other transit operators, and increased weekend service. These changes reflect a major shift in approach for Caltrain, which has traditionally been a commuter rail service focused on office workers traveling during peak periods. SFMTA developed an equity toolkit to help improve Muni service to nine equity neighborhoods by improving access to jobs and key destinations by identifying and fixing gaps in service. During the pandemic, Muni prioritized service for high-ridership Muni routes, transit-dependent populations, and connections to essential jobs and services. As a result, people living in the nine equity neighborhoods have more Muni service than people in other neighborhoods.
4. How will vehicle miles traveled (VMT) evolve as the pandemic abates? What are the CEQA consequences?
The pandemic reduced travel across all modes; therefore, there is less driving than before, and therefore, VMT is down. It seems rather straightforward, but actually is a little more complex. As households and employers rethink their locations, as travelers consider concerns over shared modes of travel, and as automobility looks ever more attractive with emptier freeways, the true VMT effects of the pandemic emerge as far from clear. Similarly, the impact of the global economic slowdown on climate change is still coming into focus.
Furthermore, how should we deliver believable VMT findings in the new, post-pandemic world? Regional travel models were calibrated and validated based on pre-pandemic data. New data sources, such as StreetLight Data, and new analytical approaches may be needed to calculate VMT based on current, credible information.
5. What’s happening on the street—and on the sidewalk?
The must-have item in spring 2020 (other than masks, of course) was the bicycle. People with spare cash on hand turned to bikes, scooters, and other active transportation tools for exercise, recreation, and to replace transit trips that no longer felt safe. Cities across the Bay Area initiated Slow Streets programs, opening new acreage for walking and biking. However, not everyone was able to find or afford bikes, and not all Slow Streets were well received.
Will the spike in bicycle/pedestrian activity prove durable? How should cities accommodate these travelers with quick-build and longer-term infrastructure, programs, and policies? What role do micromobility providers have to play, and are new markets now available to vendors in this space? What about the safety ramifications of greatly increasing foot traffic and bike volumes?
6. What’s next?
In this current era, we all must expect the unexpected. We don’t know exactly what’s going to happen one year or three years from now, but we have the tools to track trends across economic sectors, geographic contexts, and travel modes, all of which can help clients and community leaders make near-term decisions that are effective now and resilient into the future.
Fehr & Peers invests in understanding current conditions, anticipating the future, and thinking about what this means for clients. Interested in talking more about this topic? Give us a call, partner with us, and we’ll figure out solutions together for your local community.
Quick Links
© 2017 – 2024 Fehr & Peers. All rights reserved.

