TrendLab+ 2020:
A New Tool to Evaluate Post-Pandemic Travel Demand
Much has been written in the last few months about how travel patterns have changed due to the COVID-19 pandemic. We have seen some startling trends, including dramatic decreases in transit usage, where some systems saw ridership decline by 95% or more. There were also large decreases in the overall amount of driving, with reductions in vehicle miles traveled (VMT) averaging about 50% or more nationwide, though those have since started to head back up. Walking and bicycling activity has increased, resulting in booming bicycle sales around the country.
One of the focus areas in our FP Think group is the future of travel, so changes in trends are of interest to us. We originally developed our TrendLab+ tool back in 2014 to examine future trends and their resulting impact on driving activity and VMT. The current pandemic has changed many aspects of travel, and we’ve redirected and accelerated our R&D efforts in response to client feedback about today’s most pressing challenges. With that pivot in mind, FP Think has developed a new TrendLab+ 2020 version of our tool. The new version accounts not only for previously considered factors, such as demographic and socioeconomic trends, but also current factors affecting travel demand in new ways.
As a way of testing the tool’s capabilities, we identified four potential scenarios for how travel demand could change over the next three years. Preview how the scenarios performed in our beta version below now, and stay tuned for the updated TrendLab+ tool coming out next month.
Explore More About Our Tool and Process
What Factors are Changing?
In earlier versions of TrendLab+, we identified 16 key factors that independently or in combination will affect travel demand. Depending on how these factors change over time, the tool demonstrates how VMT per capita could increase, decrease, or remain relatively constant over a 20-year period.
- Willingness to share: The pandemic has resulted in a reluctance to ride transit, use transportation network company services (such as Uber and Lyft), and use shared micromobility services (such as Bird and Lime).
- Goods and services delivery: There has been a tremendous increase in the delivery of goods and services, which may point to sustained increases in travel related to on-demand delivery.
- Remote work: Working from home has become the new normal for many, which could lead to a greater share of the workforce working remotely in the future.
- Economic activity: Economic output has dropped sharply, and large questions remain about how quickly the economy will recover.
- Auto operating costs: Oil prices remain low, resulting in low automobile operating costs for now, but those may change going forward.
- Land use patterns: There could be an increased trend of suburban migration and decentralization.
- Other trends: Patterns such as increased remote learning, reduced business and tourism travel, and the level of government funding for infrastructure also stand to affect travel demand in the future.
We expect there will continue to be substantial changes in the way we travel in the short term, so we developed the 2020 version of TrendLab+ to focus on a shorter time period over the next three years. Trends established over the next few years could have a large effect on long-term demand, so at the same time we also must consider implications for the longer-term future of travel.
In our updated tool, we’ve chosen to focus first on levels of driving and transit demand, though we also plan to incorporate elements to forecast walking and biking activity and other transportation system performance measures, such as safety.
How Do We Model These Factors?
We began our research with literature to understand how factors similar to the current situation have influenced travel in the past. But since the literature only focuses on previously identified trends, we also turned to our FP Think team’s expertise to identify likely ranges and elasticities of travel demand to fill in the gaps.
As a way of testing the tool’s capabilities, we identified four conceptual scenarios for how travel demand could change over the next three years. While there are a number of potential scenarios that could occur, for simplicity we limited our initial focus to four:
- Increased Driving: Under this scenario, driving demand could increase more rapidly than transit and other shared modes, as travelers are reluctant to ride these modes until a COVID-19 vaccine is widely available. Oil prices may increase, but will still remain low compared to historic levels.
- Some Return to Pre-Pandemic Conditions: A moderated trend will dampen the dramatic swings in travel that have occurred in the last several weeks. Transit demand will rebound sooner, and there will continue to be an increase in walking and bicycling demand as preferred travel modes in many areas. As a result, driving demand will not rebound as sharply.
- Home-Focused Shift: Under this scenario, the shift toward remote work and remote learning will become permanent in some industries and organizations. As a result, commute travel could remain lower over time, and there will continue to be an increase in home goods and service delivery.
- Extended Recession: If the economy enters into a deep, sustained recession, we’ve seen from past recessions that travel demand for all modes tends to decrease. Under this scenario, driving and transit demand will remain low for the next two years, after which it will begin to return to previous levels.
What are the Results?
After running these scenarios through a beta version of our TrendLab+ 2020 tool, we see several potential outcomes over the next few years:
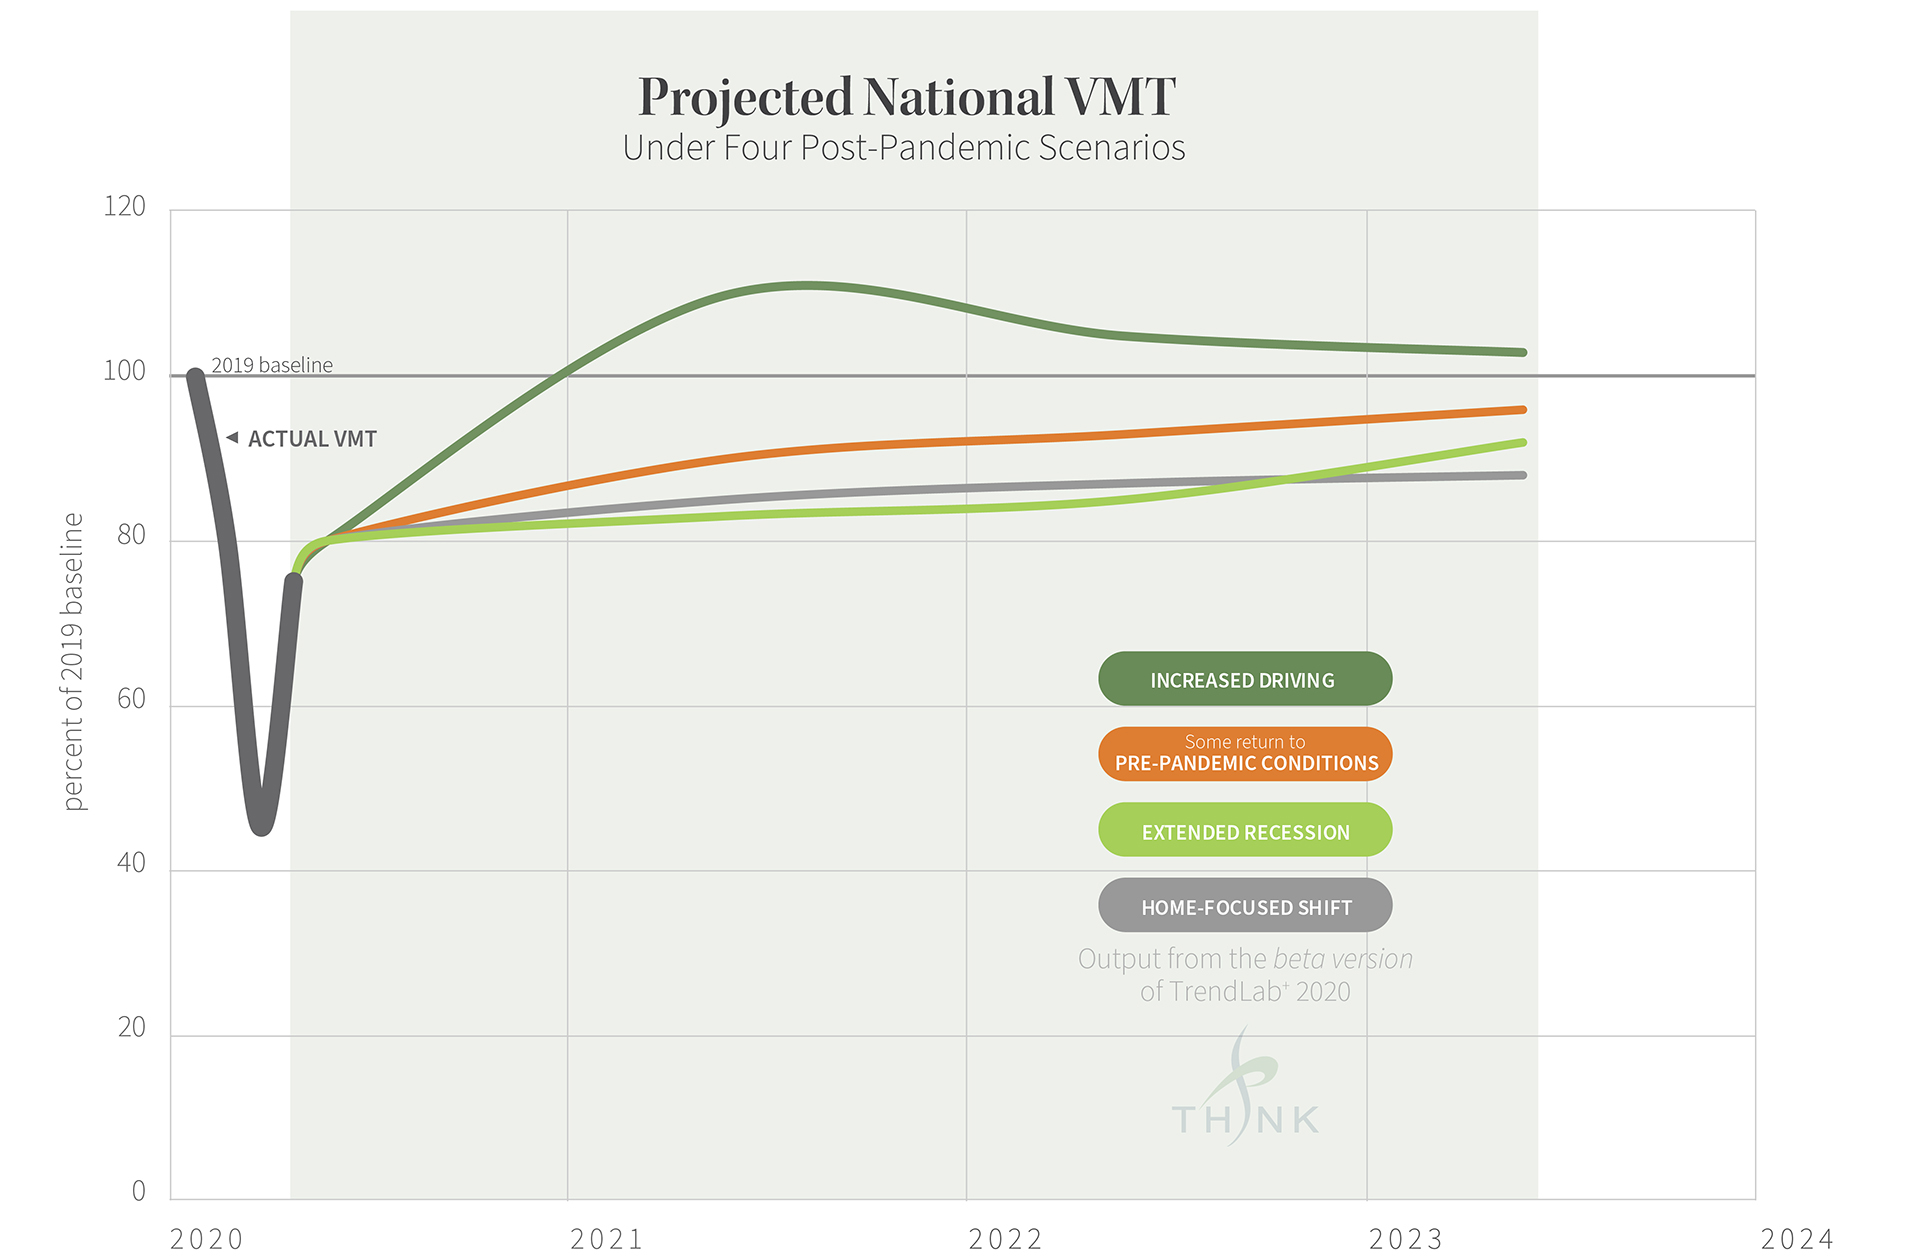
- Total VMT could remain well below 2019 levels, or it may increase by 5-10% if more people choose to drive rather than take other travel options.
- The Home-Focused and Extended Recession scenarios would see VMT remaining relatively flat over time, at around 10-15% below previous 2019 demand.
- Under an Increased Driving scenario, a VMT “peak” may occur in 2021 and then moderate slightly as the preferences for other non-driving modes increase in subsequent years.
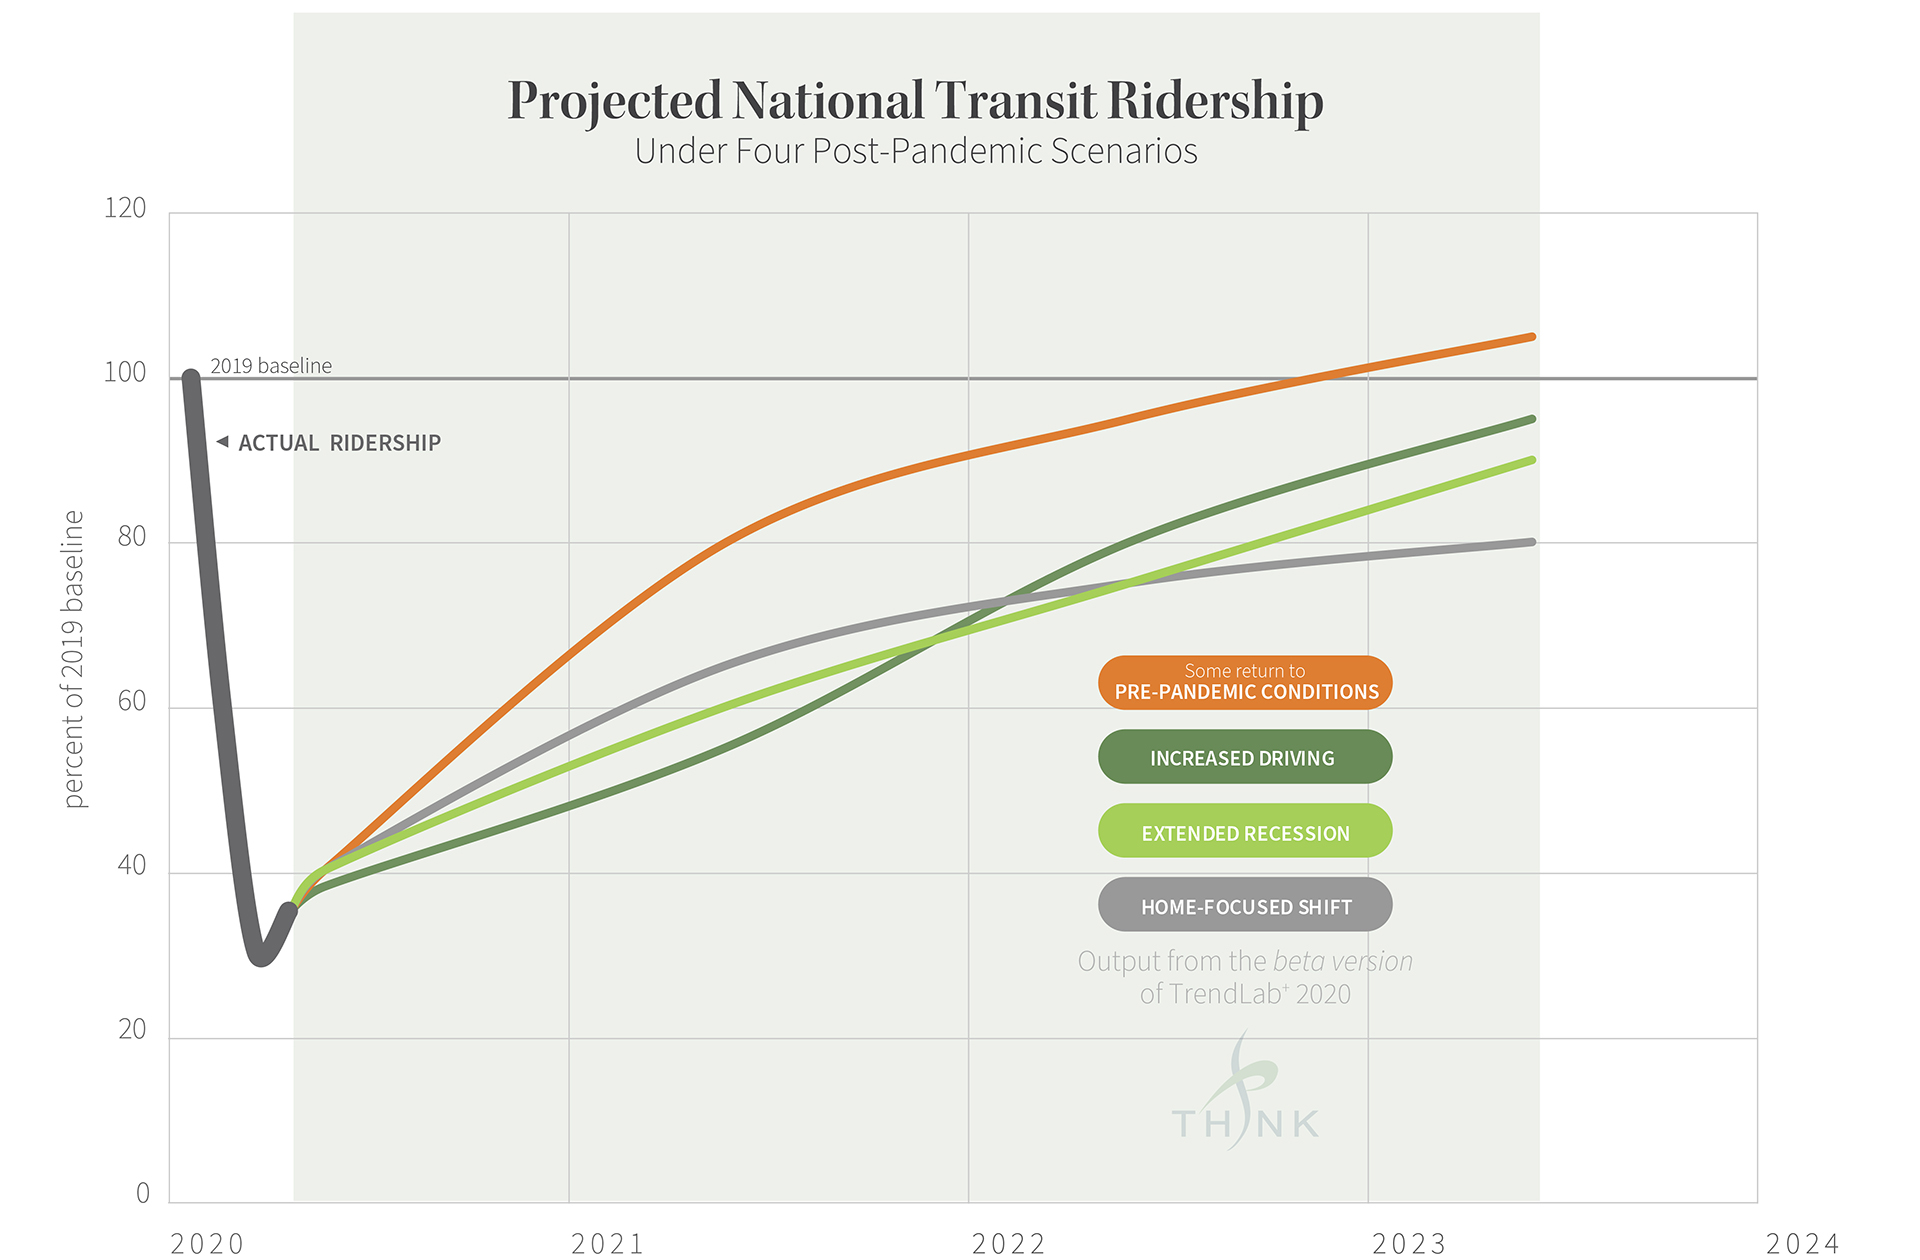
- Transit may rebound from current historic lows, though the magnitude of the rebound and duration of the recovery period is uncertain. Under a Some Return to Pre-Pandemic Conditions scenario, we could be back above previous transit ridership levels by 2023, but under other scenarios a full rebound could take longer.
- The transit recovery period also depends in part on actions taken by the transit agencies to weather severe revenue declines and assure riders of their safety.
The conceptual scenarios above do not consider potential strategies agencies could implement to help counter the effects of these trends. We expect to share more results from our TrendLab+ 2020 tool over the coming weeks. In the meantime, please contact us if you would like to discuss our results, learn more about our research, or talk about ways we can develop a customized version of this tool for your region.


