ITE Western District Annual Meeting 2019
Join Our Sessions
 Monday | June 24
Evaluating Success: Complete Streets Before and After
Session 3A: Complete Street Evaluations
Presenter: Kendra Rowley
Time: 1:00pm–2:30pm
Location: Spyglass
As best practices continue to evolve for the design of pedestrian- and bicycle-friendly intersections and streets, there is a need for evaluation of new installations. Practitioners are often faced with the question “Is this project actually doing what it was intended to do?” and the traditional metrics of traffic volumes and level of service do not convey the full picture of success for a complete streets project, while relying on a change in collision patterns after a project is completed means waiting several years.
This presentation aims to present a recommended process for evaluating complete streets projects, based on a case study in the San Francisco Bay Area. The presentation will cover data collection methodology, metrics, and sample results chosen to address five different categories: Vehicle Flow, Bicycle Activity and Environment, Pedestrian Safety, Signal Compliance, Loading and Unloading, and Transit Service. The goal is to create a framework for practitioners to consider when evaluating future projects, to emphasize the importance of consistent data collection methods as an industry, and to present unique methods for evaluating safety in the near term when long term collision data is not practical.
The Bigger Picture: Using Big Data to Determine Effects and Benefits After Project Implementation
Session 3A: Complete Street Evaluations
Presenter: Ian Barnes
Time: 1:00pm–2:30pm
Location: Spyglass
Autonomous Vehicles on Arterial Streets and Intersections: A Simulation Analysis
Session 3B: Autonomous/Connected Vehicles
Presenter: Allen Wang
Time: 1:00pm–2:30pm
Location: Big Sur
Various research studies have evaluated the potential operational benefits of autonomous vehicles (automated vehicles, driverless cars, self-driving cars) on freeway systems with uninterrupted traffic flow. While autonomous vehicles could potentially improve freeway operations, it is uncertain how autonomous vehicles would influence local intersection and arterial operations where the traffic flow is interrupted by traffic signals and the roadway space is shared with other modes of travel (e.g. bicycles, pedestrians, and transit vehicles). Based on past research, we developed a number of driving behavior schemes to represent varying degrees of aggressiveness and connectivity of autonomous vehicles. Following this, we used calibrated microsimulation models created in the Vissim microsimulation traffic analysis software to test the driving behavior schemes with different levels of autonomous vehicle penetration. The findings are intended to guide decision makers when considering future transition into the autonomous vehicle environment.
System Integration Equals Seamless Mobility: Fiber Optic System
Session 4B: Operations and Design
Presenter: James Sellards
Time: 3:30pm–5:00pm
Location: Big Sur
Fehr & Peers helped the cities of Oakland and Alameda integrate transportation on the Park Street corridors on two levels: First, a modal integration of cars, bikes, pedestrians, buses, trains and boats, and second, an integration of completely separate control systems.
We designed a fiber optic system and a Local Area Network (LAN) to provide communication between a railroad controller, drawbridge control system, three traffic signals, and multiple extinguishable message signs. The network crosses the Park Street Bridge, which spans the Oakland Estuary and links Alameda and Oakland. The bridge itself is 125 years old, and carries 40,000 travelers a day.
Kicking Chaos to the Curb: Using ITE’s Curbside Management Guide
Session 4C: Curb Management Guidelines
Presenter: Steve Davis
Time: 3:30pm–5:00pm
Location: Cypress
In November 2018, ITE released the Curbside Management Practitioner’s Guide for local jurisdictions on how to inventory, assess, enhance, and prioritize curb spaces to meet the growing multimodal demands at the curb in a safe and efficient way. The Practitioner’s Guide addresses key gaps in existing curbside guidance, focusing on how to measure curbside performance, how to identify and resolve trade-off considerations, and how to explain the value of curb uses to stakeholders. This session will introduce the guide and discuss priorities and strategies for organizing the public realm through curbside management.
Re-Envisioning the Curb: A Framework to Improve Access for People
Session 4C: Curb Management Guidelines
Presenter: Geoff Rubendall
Time: 3:30pm–5:00pm
Location: Cypress
Fehr & Peers has evaluated several locations in San Francisco and Cincinnati to understand and quantify the relative demand for curb space in a variety of street typologies and contexts. Using guidance from the ITE Practitioner’s Guide and a comprehensive data collection strategy, including data from Uber, we quantified the relative curb productivity of various modes in various street typologies. Together, these studies provide a framework cities can use to address some of their curb space-related safety and access issues in their communities where their priorities are to improve the safe and efficient access for people.
 Tuesday | June 25
Envisioning the Future of the Curb with Procedural Streets
Session 5C: Curb Management
Presenter: David Wasserman
Time: 8:00am–9:30am
Location: Cypress
Spatial analysis and data visualization provide a powerful vehicle to help communities make informed decisions on how they approach mobility planning in their communities. As cities look to identify alternative uses of curb space in an emerging era of shared mobility, geodesign tools that connect geographic context, impact analysis, and 3D visualizations can be helpful in exploring different curbside allocations. This presentation will explore two case studies on how procedural modeling and a geodesign process can help manage the curb. The first case study establishes how a layered network framework can help evaluate multimodal improvements at scale, and the second explores how a similar geodesign framework can simultaneously identify trade-offs and communicate curbside scenarios.
Parking in Santa Clara County: A Regional Analysis of Housing, Parking Supply, Demand, and Perceptions of Occupancy
Session 7C: Parking/TDM
Presenter: Ryan Caldera
Time: 1:30pm–3:00pm
Location: Cypress
 Wednesday | June 26
Fremont's Approach to Targeting Corridor Improvements
Session 9B: Corridors
Presenter: Josh Peterman
Time: 10:30am–12:00pm
Location: Big Sur
The City of Fremont is invested in innovation and technology, but not simply for technology’s sake. The Fremont Boulevard Safe & Smart Corridor project aims to accomplish the following: 1) achieve smoother and safer travel speeds on the corridor, 2) improve auto travel time reliability for those that follow speed limits, 3) improve transit reliability and raise the value of transit relative to auto travel, 4) reduce bicycle and pedestrian collisions by implementing selected City Vision Zero goals, 5) improve energy efficiency by enhancing the ability of roadway lighting to adapt to roadway use, and 6) improve parking utilization at a key transit/rail hub in the city.
The project is unique in that these accomplishments are to be made primarily through technology – traffic detection and monitoring systems coupled with AI and advanced analytics, connected vehicle communication, connected mobile applications for bicyclists, adaptive traffic signal control, and conditional transit signal priority. Fremont has experimented with some of these systems elsewhere but the scope of this project is unprecedented – when complete the corridor will cover 10 miles and 34 traffic signals. The project is just starting the preliminary engineering phase and will be under construction in 2020.
Using Big Data to Forecast First/Last Mile Transit Ridership
Session 9C: Big Data
Presenter: Briana Calhoun
Time: 10:30am–12:00pm
Location: Cypress
Josephine Community Transit (JCT) in Josephine County, OR plans to expand bus service but wants to explore options outside of adding new fixed routes. To do this, JCT applied for and was awarded a grant to explore on-demand vehicles as first/last mile connections to their fixed route. Currently, bus service is limited to weekday daytime hours and a large portion of ridership is transit dependent, so there are many residents that may not have access to jobs and services.
The goal of the analysis was to understand ridership impact, costs, and the intricacies of implementing a first/last mile service in Grants Pass. To do this, mobile phone and GPS data, the ridership survey, demographics, and data from similar pilot programs were used to create a methodology to estimate ridership for the following multiple scenarios:
- A first/last mile service
- Point to point daytime service that expanded the geographic service area
- Point to point evening service to provide longer service hours
All three were evaluated under two different provider models—operated by a TNC or operated by Josephine Community Transit. The report evaluated the cost to implement each type of service, and provided recommendations and guidance on the operations of these services.
As this is a fairly new type of service and there is not a standard methodology for estimating ridership, the session will explain how big data informed this process and how ridership estimates were calibrated with the data available from data vendors, the Census, and the rider survey.
The Future of Urban Goods Movement: An Implementation of Data Driven Methods
Session 9C: Big Data
Presenter: Mike Wallace
Time: 10:30am–12:00pm
Location: Cypress
Urban deliveries are increasing due to people’s on-demand expectations, and the proliferation of e-commerce companies. As communities encourage and implement higher-density and mixed-use developments, the needs for commercial and residential deliveries have become more complex. A rising demand of curb space and sidewalk management correlates to increased conflicts. A recent metric to evaluate the allocation to different users is the Curb Productivity Index. This paper focuses on the urban freight delivery aspect, which is an important and often overlooked field in transportation planning.
We evaluated two distinctly different approaches to evaluate on-demand goods delivery. The first and most common approach uses traditional freight travel demand models. Unfortunately, traditional travel demand models perform well with regional travel activities, but do not provide the capability of reflecting changes to the types of parameters relevant to urban goods delivery, including curb space usage or location of parking and delivery time.
The second approach utilizes a hot-spot analysis by calculating a suitability index based on locations where supply and demand are not aligned. Since delivery activity depends on factors that go beyond the curb or street, the model uses population and employment density, land use mix, delivery vehicle type and location, and socio-economic factors to forecast delivery demand. The results of the analysis illustrates where demand for delivery vehicles will be highest. By using the hot-spot analysis, design guidelines, parking policies, and context sensitive solutions can be developed to accommodate all street users and provide the most productive use of public assets.
Connect With Us
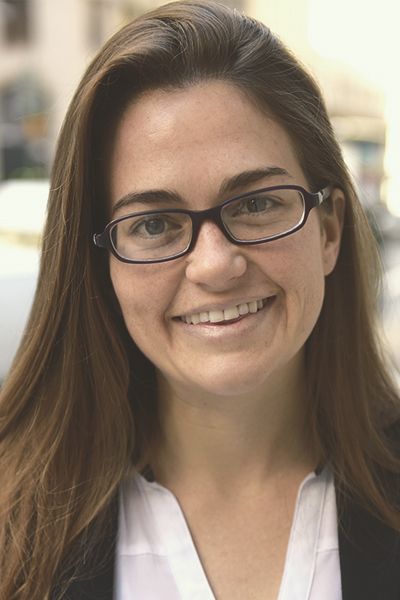
Kendra Rowley
Senior Transportation Engineer
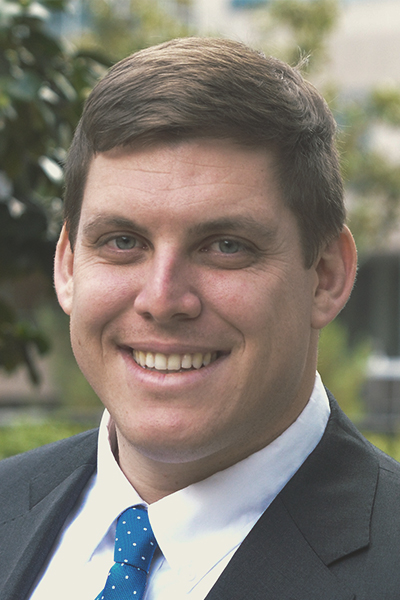
Ian Barnes
Associate

Allen Wang
Transportation Engineer
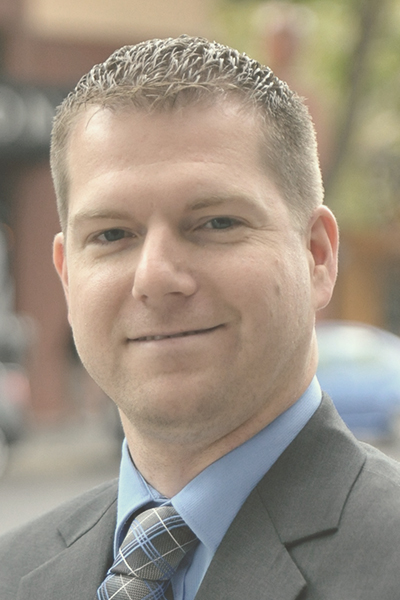
Steve Davis
Associate
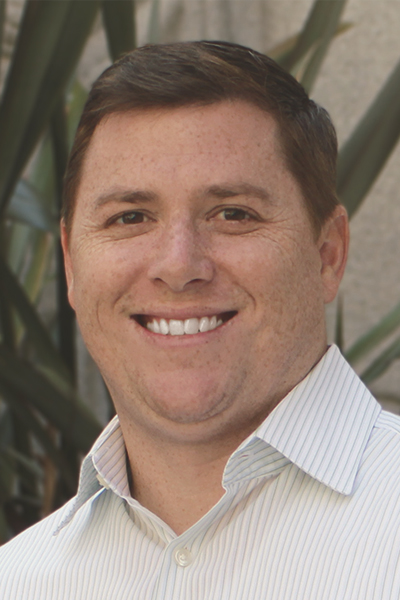
Geoff Rubendall
Associate
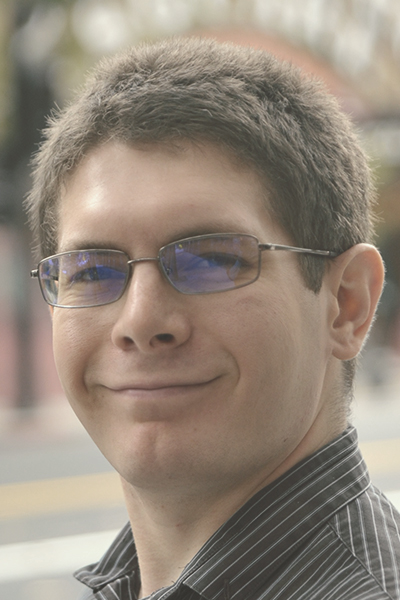
David Wasserman
Transportation Planner / Data Scientist

Ryan Caldera
Transportation Engineer / Planner
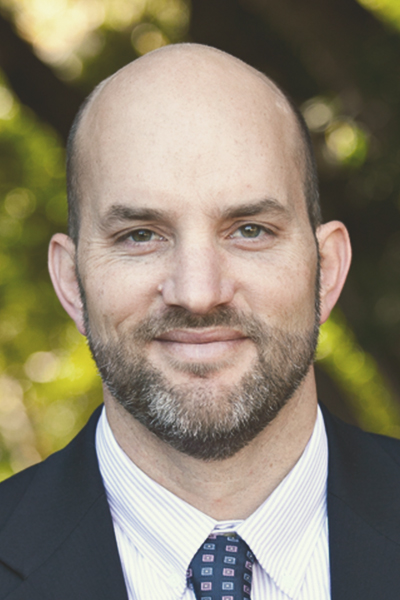
Josh Peterman
Principal

Briana Calhoun
Transportation Planner / Engineer

Mike Wallace
Senior Forecasting Practice Leader
Quick Links
© 2017 – 2024 Fehr & Peers. All rights reserved.

