Infrastructure Projects & Greenhouse Gas Emissions
Finding the Balance for Benefit
Can freeway infrastructure projects have a greenhouse gas (GHG) emission benefit by improving travel speeds and reducing tailpipe emissions? The following case studies show that the answer depends as much on the type of infrastructure project as on the type of modeling that is used, and whether the modeling fully captures induced vehicle travel effects and operational benefits of the project. Conceptually, achieving both objectives should be possible. However, it requires a ‘Goldilocks’ combination, where the project is designed to alleviate just enough congestion without being so effective that the congestion reduction induces new vehicle miles traveled (VMT). The modeling approach must recognize this unique balance and contain sufficient sensitivity to travel demand and supply effects.
We have assembled three case studies from recent project work that demonstrate the differences of modeling approaches and their effect on VMT and greenhouse gas (GHG) emissions. A complete technical approach will enable accounting for changes in travel behavior associated with the project (i.e., accounting for induced vehicle travel effects), while also accurately estimating the travel speeds (and ideally, number of stops) under no-build and build scenarios to inform the GHG emissions estimates.
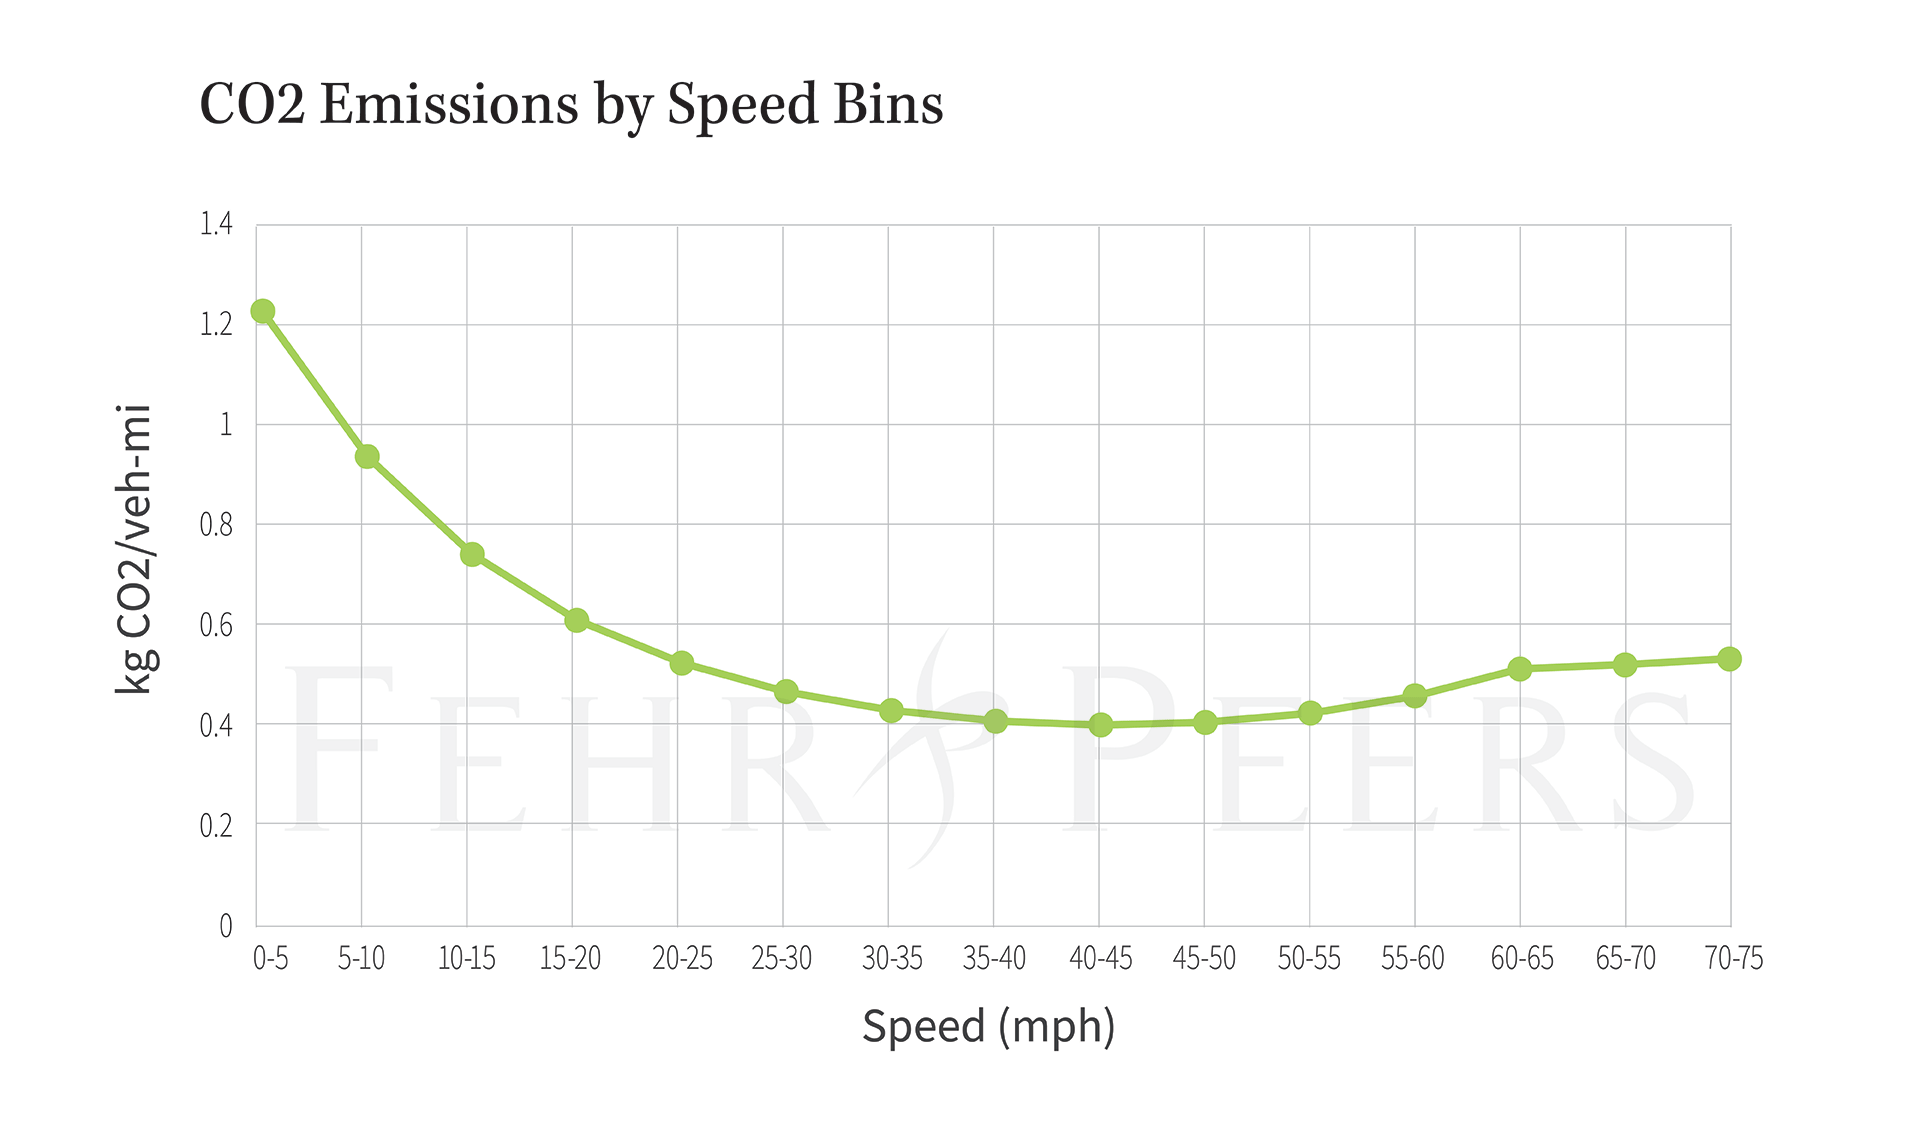
GHG emissions are commonly calculated using forecasts of VMT that are grouped according to the average speed of the traveling vehicles. Slower-moving vehicles generate more pollutants, while travel speeds between 40-50 miles per hour (mph) tend to represent the most fuel-efficient operating conditions for internal combustion engines.[1] Each of the case studies calculated GHG emissions using emission factors by speed bin and VMT estimates from the travel model used for the project analysis.

HOV to HOT Conversion & Regional Travel Demand Forecasting Model
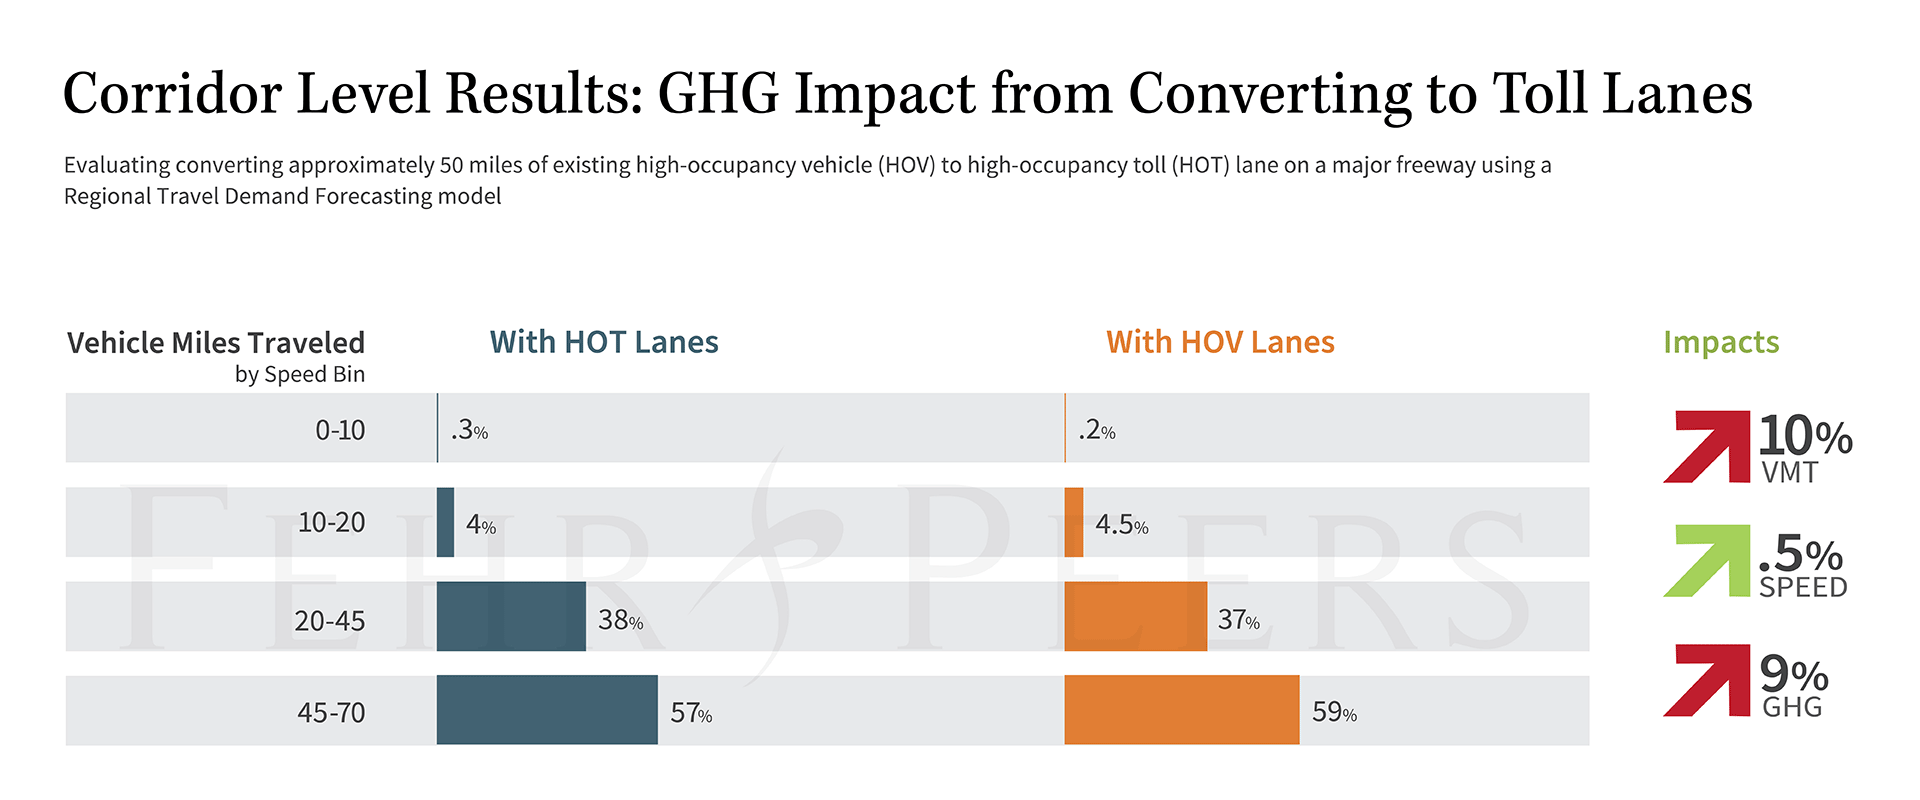
Converting a high-occupancy vehicle (HOV) lane to a high-occupancy tolled (HOT) lane has the potential to improve travel speeds in a freeway corridor. HOT lane operations are only allowed when the HOV lane has enough capacity to accommodate additional vehicles. A single-occupancy vehicle (SOV) may buy into the HOV lane if its addition does not compromise the desired minimum speed of the HOV lane, which typically is no lower than 45 mph. Shifting SOVs out of congested general-purpose travel lanes improves lane operation and provides the potential for reduced GHG emissions.
In this case study, Fehr & Peers used a regional travel demand model to evaluate converting approximately 50 miles of existing HOV lanes to HOT lanes on a major freeway. The model results showed that the project caused induced vehicle travel effects that increased VMT on the freeway facility due to increased travel speeds. However, this approach may not capture all the effects of induced VMT without verifying the model’s sensitivity to new capacity and evaluating the region-wide effects. The increase in VMT along the corridor was high enough to more than offset the benefit from the speed increases, and GHG emissions also increased on the study corridor.
To assess the full effect of the project on VMT and GHG, we also expanded the analysis area to include the full four-county region covered by the TDF. Across the entire model area, some project-level benefits were washed out, but the conclusions remained the same and model-wide VMT and GHG emissions increased.
Freeway Expansion & Microsimulation Model
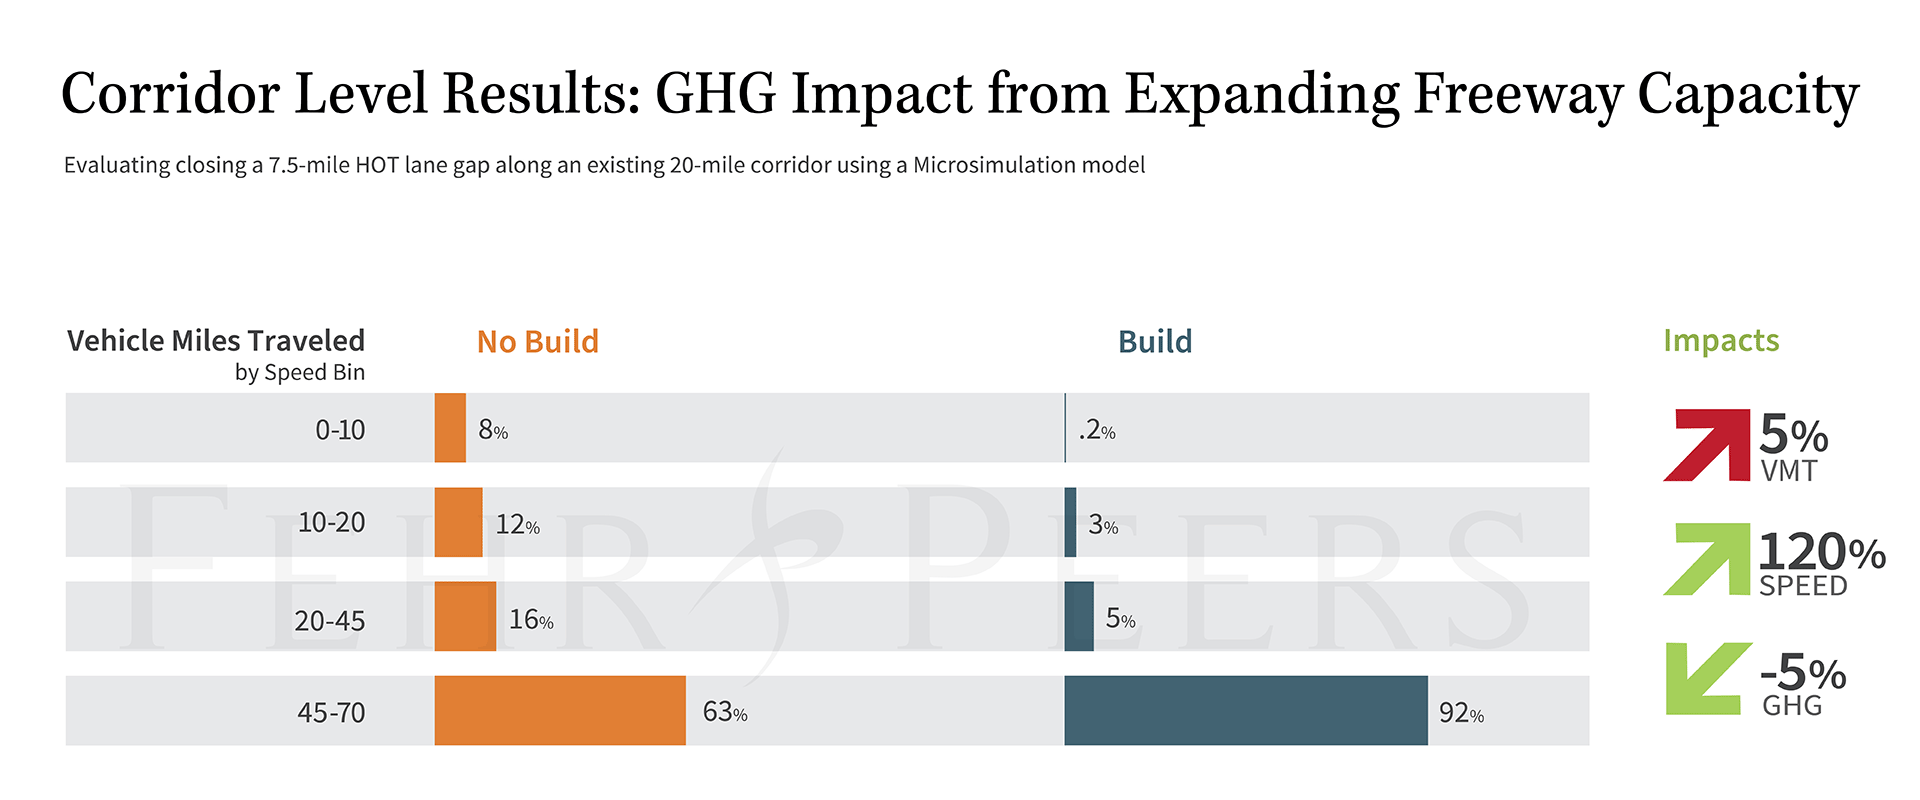
Expanding freeway capacity may come in many forms. Managed lanes, which include both HOV and HOT lanes (also called express lanes), offer the potential to improve travel speeds and reduce congestion. For this case study, Fehr & Peers evaluated adding capacity to close a 7.5 mile HOT lane gap along an existing 20-mile corridor. The project would allow more SOVs to buy into the HOT lane while also reducing weaving maneuvers at the existing gap between facilities.
Fehr & Peers used a microsimulation model to analyze the VMT and GHG effects of the gap closure project. The model results showed that speeds along the corridor more than doubled under the build alternative, and delay was reduced almost 90 percent. These benefits induced a five percent increase in VMT caused by more vehicles being able to complete their trip during the peak analysis period. The project’s speed increase and congestion reduction shifted VMT into much higher speed bins, and the model showed an overall decrease in GHG emissions. Since the study area for the microsimulation model only included the freeway corridor, the model is not able to estimate the potential for and effect of induced travel.
Microsimulation models paint a more accurate picture of operations along the study corridor but are typically limited to a smaller study area and do not capture as much of the induced travel effects compared to regional travel demand models. Furthermore, microsimulation models are usually only set up for peak periods, so they may not provide a complete picture of GHG emissions across the entire day.
Freeway Expansion & Dynamic Traffic Assignment Model
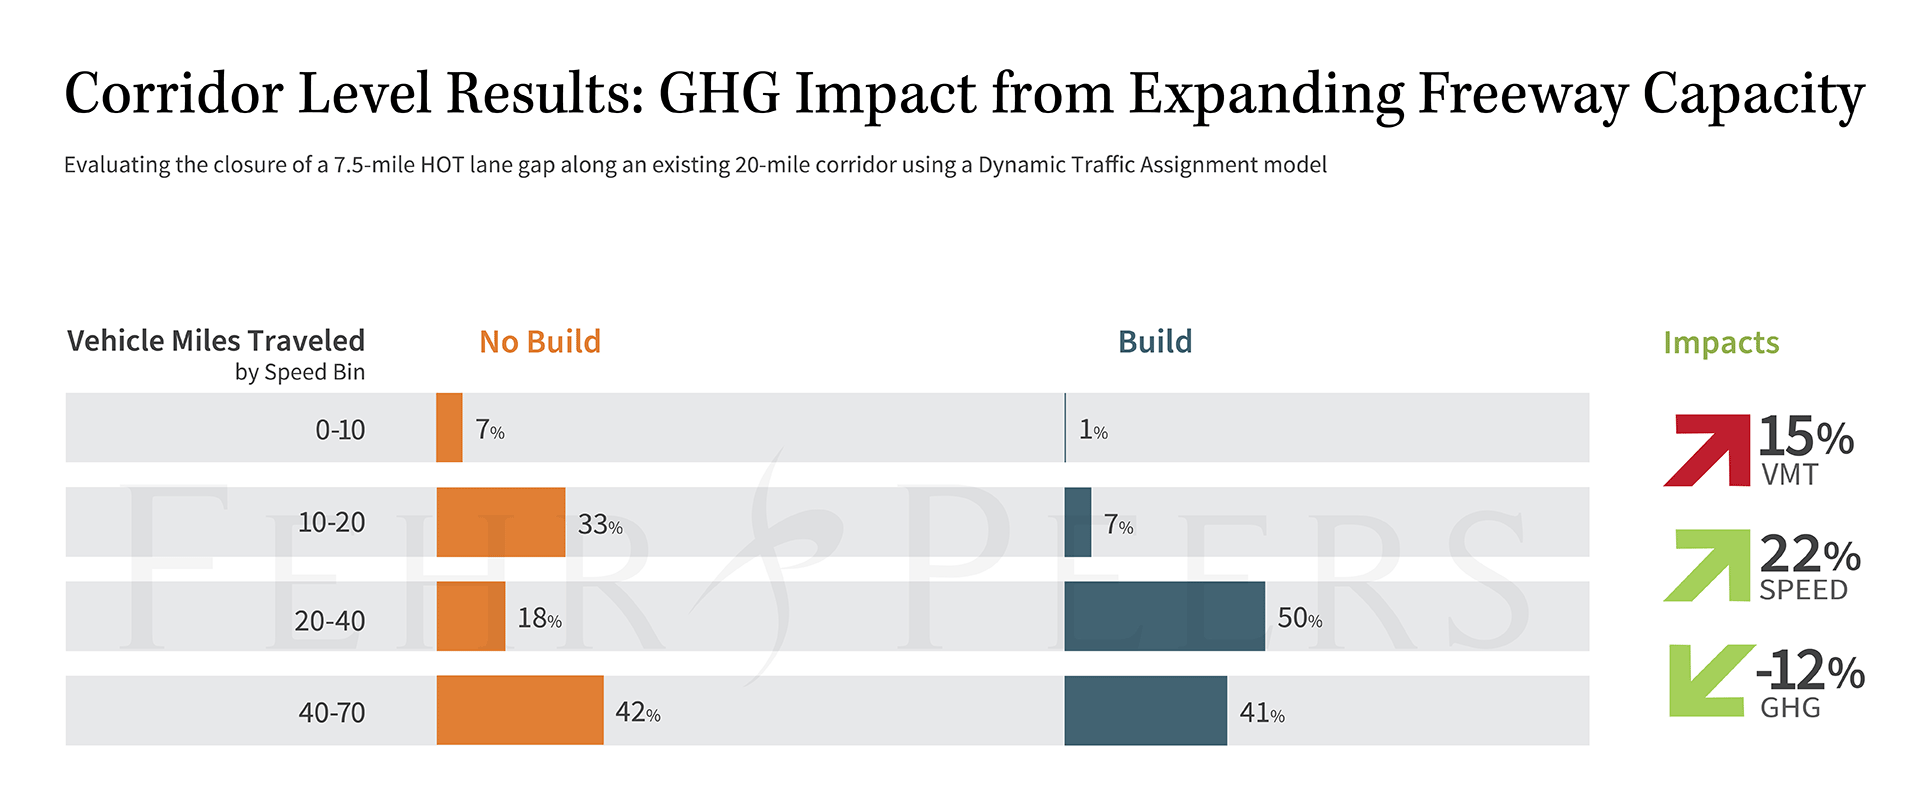
The final case study evaluated the widening of a short two-mile section of a freeway that is routinely congested during the PM peak. The widening would provide additional capacity that connects to a major freeway and would reduce the amount of cut-through traffic on nearby arterial streets. The project was evaluated using a subarea mesoscopic dynamic traffic assignment (DTA) model that extended approximately five miles in all directions from the project location.
The project scenario resulted in a slight increase in VMT across the subarea, but an overall decrease in GHG emissions due to the increase in travel speeds along the project corridor. VMT increased because travelers shifted from arterials to freeways, resulting in longer distance trips on the freeway with faster travel times. The increase in speeds along the project corridor offset the increase in VMT and resulted in fewer overall GHG emissions. Across the entire subarea, results also showed a slight increase in VMT and overall decrease in GHG emissions. This project showed a greater GHG emission reduction because of the freeway’s lower speed limits than the other two freeway projects. The lower speeds constrained most of the VMT in the 35–45mph speed bin, which has a lower GHG emission rate per mile traveled than vehicles traveling above 50 mph on freeways with higher speed limits.
Key Takeaways
Understanding how GHG emissions change because of freeway expansion projects requires evaluating the induced vehicle travel effects from the project as well as the changes in traffic operations and vehicle speeds along the corridor. While some freeway infrastructure projects can have a GHG emission benefit, these case studies show that emissions depend on the type of infrastructure project as well as the type of model used.
- Regional TDF models excel at evaluating induced vehicle travel effects but cannot entirely capture operational and speed benefits from vehicle interactions. TDF models should also be dynamically validated to ensure they are fully capturing the effects of induced vehicle travel.
- Microsimulation models excel at analyzing speeds and vehicle operations along a corridor but cannot analyze the full effects of induced vehicle travel. These models are also limited to a smaller study area, to and peak period analysis.
- DTA models provide a valuable compromise that can evaluate induced vehicle travel changes across a larger study area while also estimating traffic speeds based on the interactions between individual vehicles.


