Evolving Standard Validation Practices for Traffic Data
10% RULE
Referring to a collection of counts for only one, or occasionally two, weekdays to represent typical weekday traffic volumes for an area. The presumption is that one to two days of counts would generally fall within +/-10% of the typical weekday volume[1]. While this rule is a common accepted standard practice, it is rarely validated due to the high costs of additional data collection and ignores the land use and transportation network context of the count site.
30TH HIGHEST HOUR
Referring to the 30th highest hour of annual roadway volumes,[2] presumed in urban areas to occur during the typical weekday commute period of 4-7 PM with 5-6 PM as a common default. Roadways and intersections are designed to accommodate this hourly volume based on the goal of balancing cost, use, and driver expectations, making it important to understand potential volume variation.
In both cases, having an expanded data sample would give more accurate traffic estimates while also providing insights into potential variations. To test this hypothesis, we acquired 365 days of turning movement volume estimates at 15-minute intervals, obtained from traffic signal detectors at over 100 intersections in the city of Roseville, California. These volume estimates are available through the City’s online database and were previously validated by Fehr & Peers against traditional manual counts.
Recognizing that most jurisdictions will not have this type of data set, we also acquired a large sample of turning movement volume estimates from StreetLight Data for several of the same intersections. If having larger multi-day data sets proves advantageous, then practitioners need a cost-effective method for collecting that data. To increase confidence in the use of StreetLight’s estimates, Fehr & Peers also relied on the City’s database to directly compare and statistically validate StreetLight’s turning movement volume estimates.
In this first blog post in a series on traffic volume estimation and StreetLight validation, we examine key questions to understand the possible variations for each of the industry standard methods noted above.
Daily Traffic Variation
Do peak hour volumes only vary by 10% or less?
What is the risk of under- or over-estimating typical volume when using one- or two-day counts?
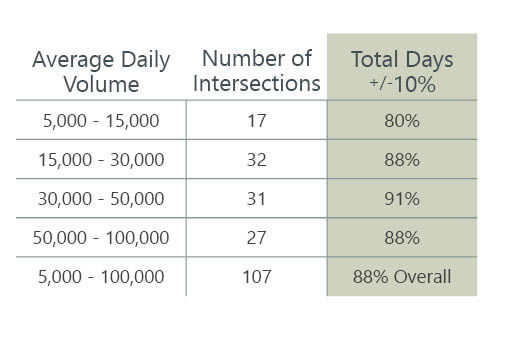
This table uses the City of Roseville’s observed data to examine the percentage of days within +/-10% of the mean for each intersection, based on the total daily volume.
Common traffic data fluctuation factors may include nearby collisions, construction, weather, special events, school traffic, seasonal recreation, and/or variable congestion on parallel or intersecting facilities (including the effects on traffic routing results from apps such as Waze or Google Maps).
Hourly Traffic Variation
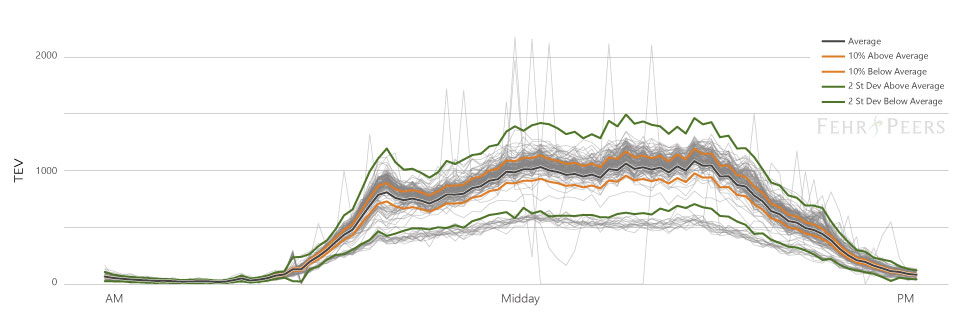
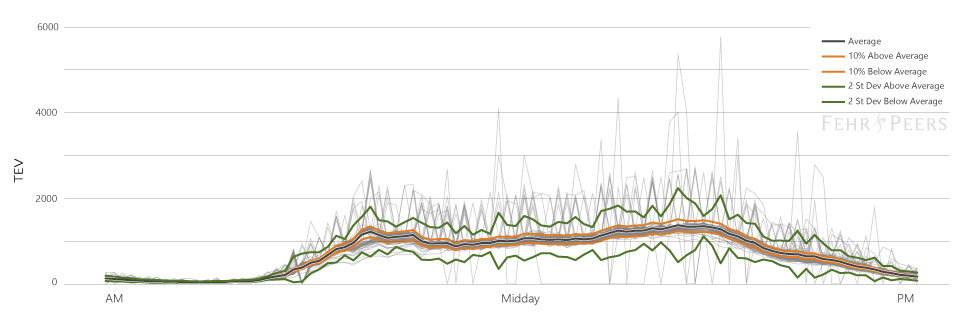
A single day of counts may only have a 40% chance of being within 10% of the mean during peak hours.
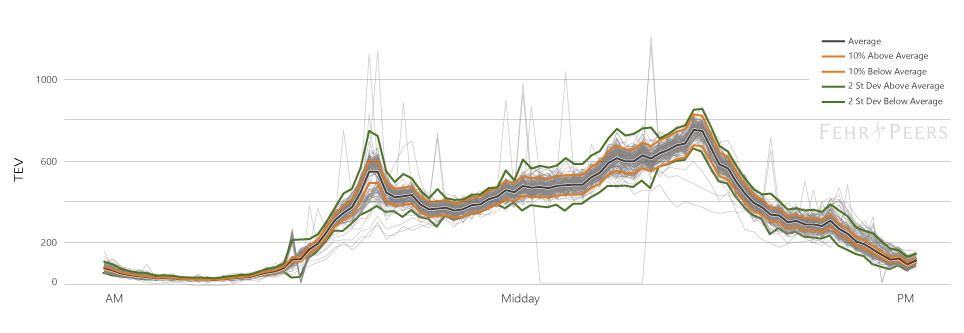
While tighter volume distribution shows over the day, there are still large variations in AM peak hour traffic.
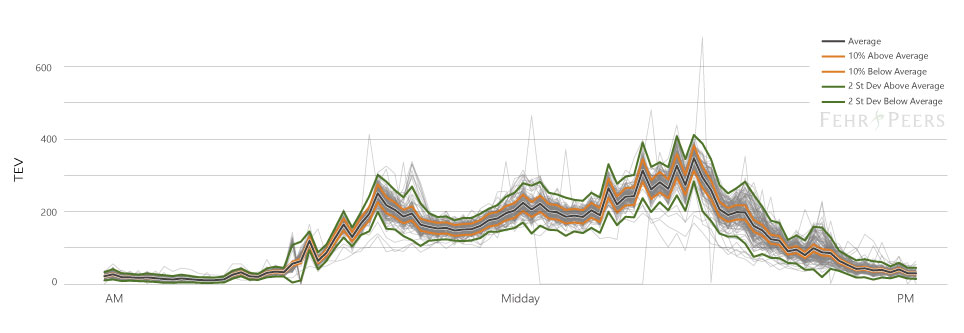
The 10% Rule captures most days in the morning and midday periods, but larger variations occur during the PM and evening.
This dataset shows if the TEV is greater than 15,000, a single day of counts is representative of an average weekday. However, practitioners rarely use daily volumes for intersection analysis; instead, the focus is on peak hours. For these conditions, the 10% Rule does not hold up at many locations. Take Cirby Way/Sunrise Avenue as an example – if the single day of counts happened to fall on a day represented along the two green standard deviation lines, peak hour turning movement counts at the intersection may deviate by over 1,000 from the weekday average. This difference would substantially affect intersection delay and level of service (LOS) calculations and may alter recommendations for the number of approach lanes.
The 30th Highest Hour
Which hours represent the 30th highest hour of intersection volumes?
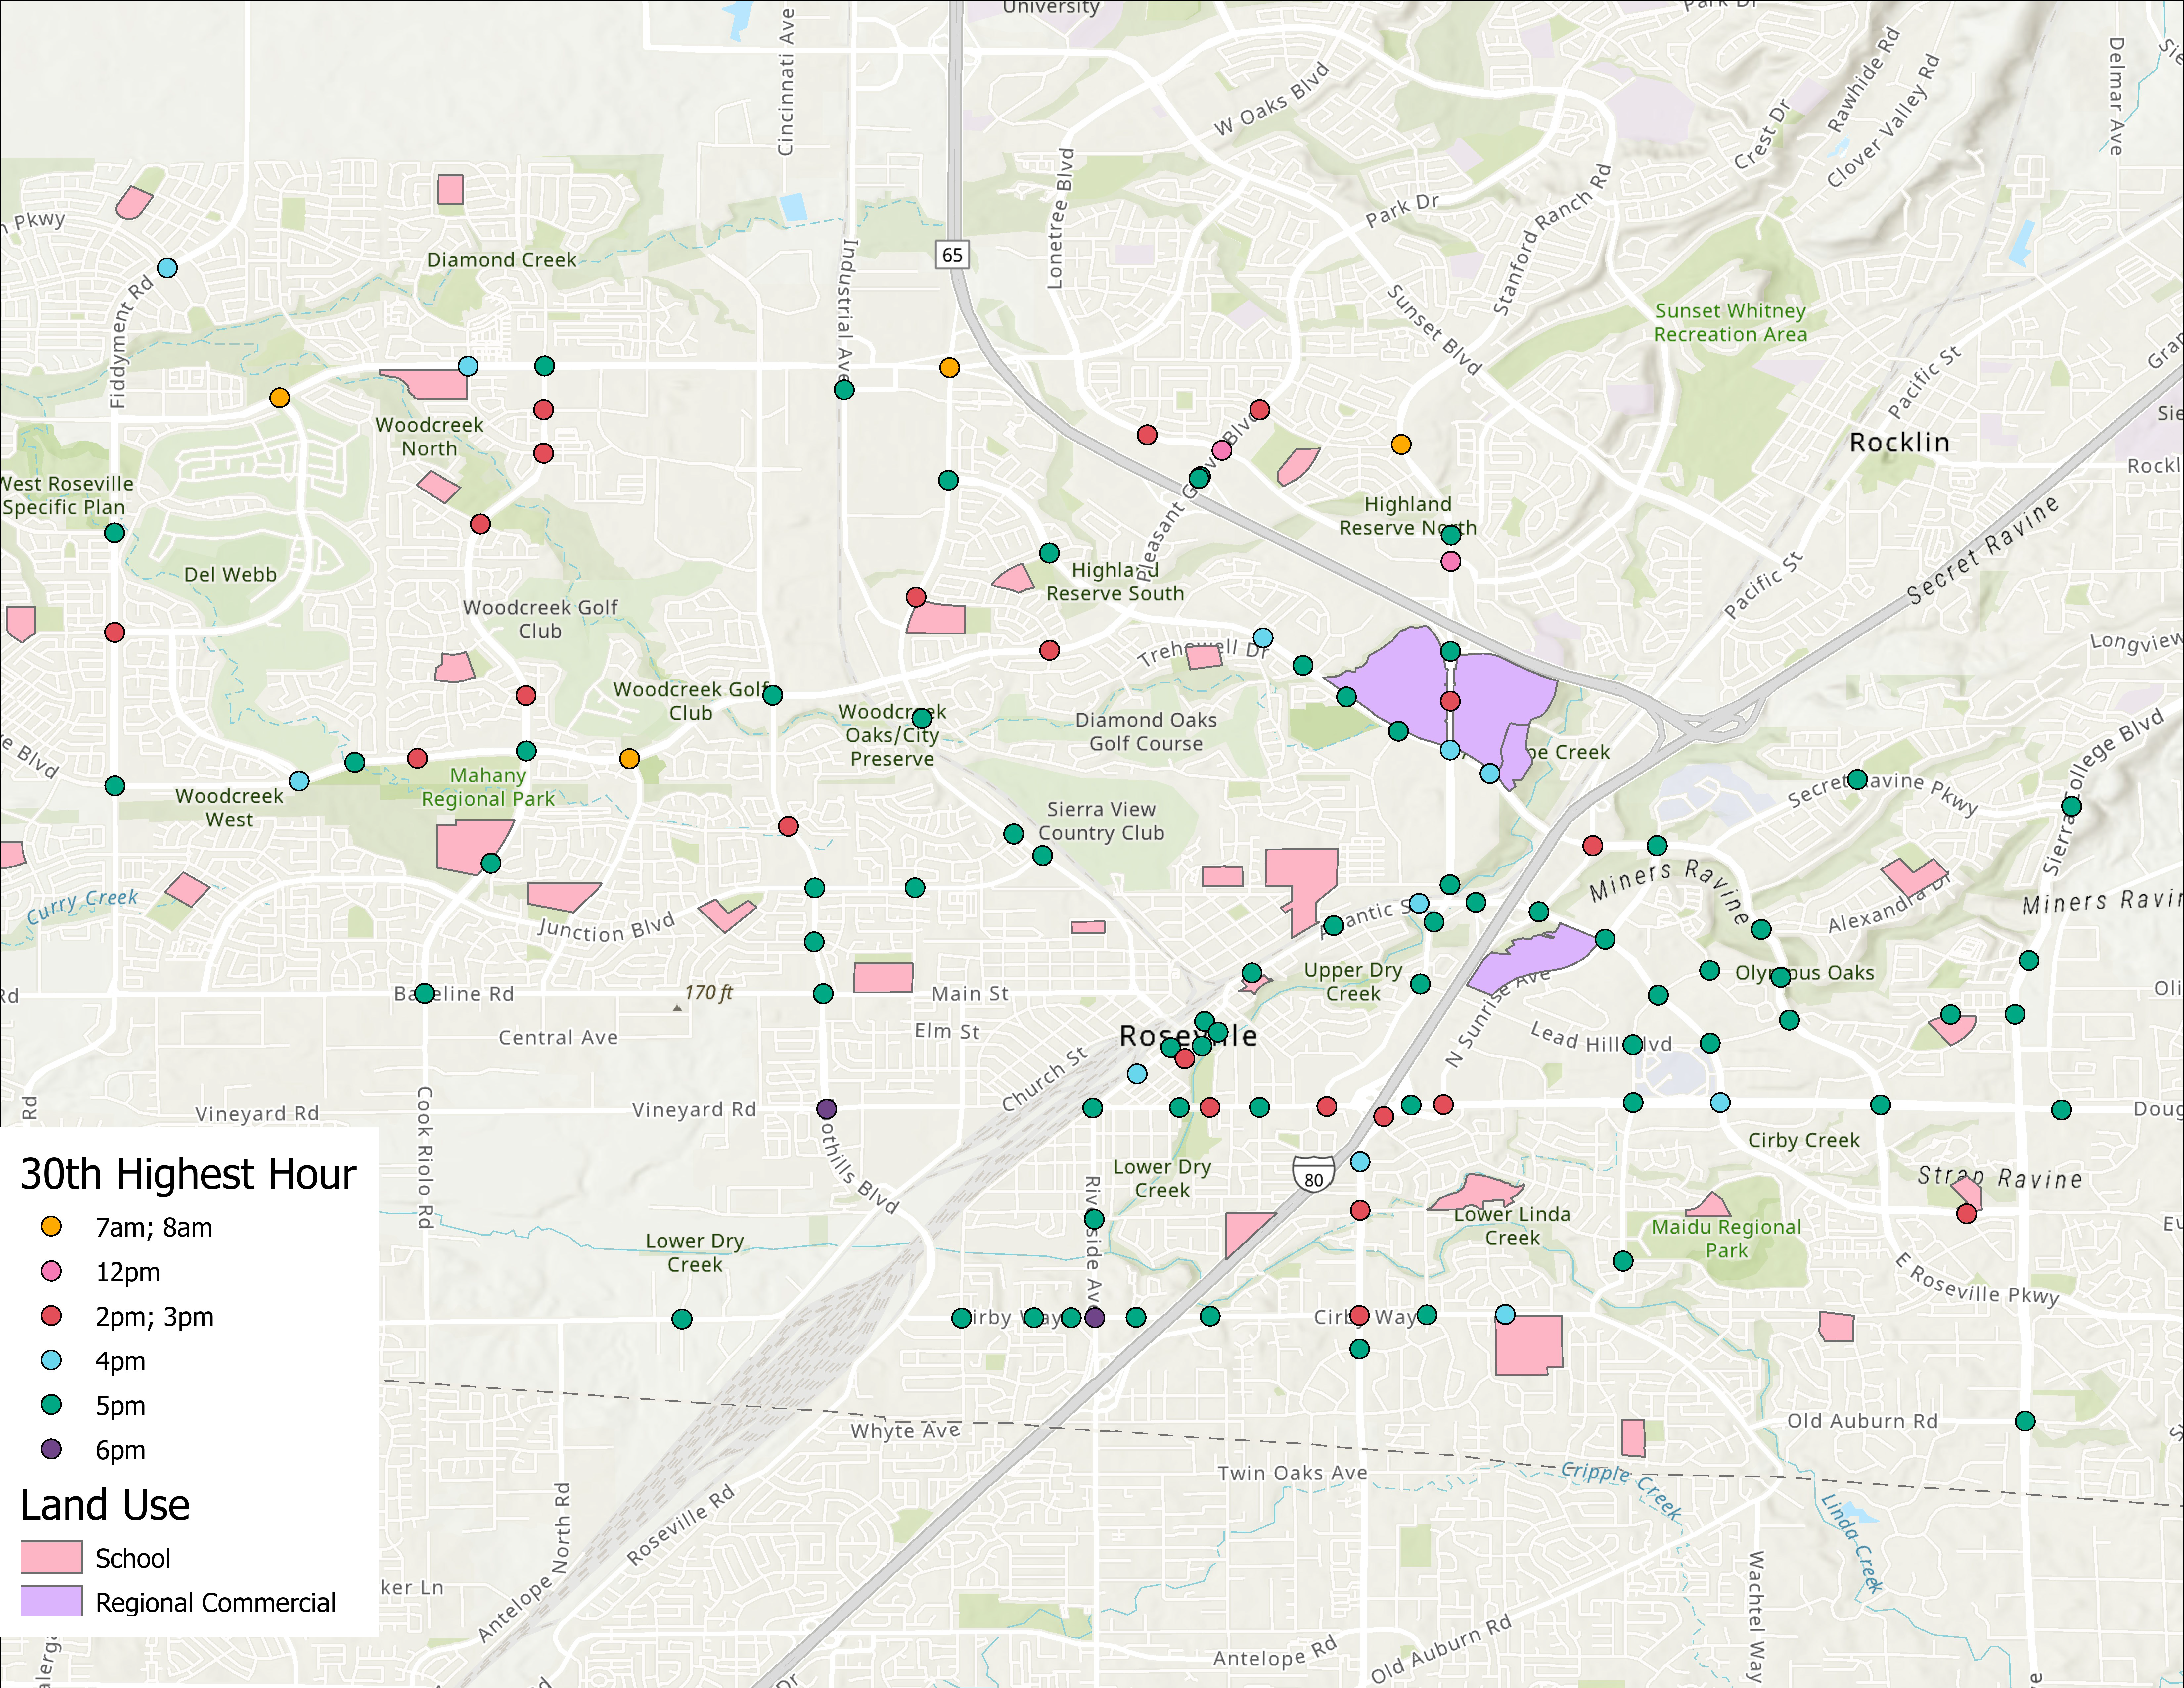
What can the Roseville data tell us about the 30th Highest Hour? Industry practices suggest that the typical 30th highest hour in any given calendar year occurs during the afternoon work-to-home travel peak (e.g., 5-6 PM on a weekday).[3] There, the 30th highest hour was found to occur between 5-6 PM on weekdays for over 65% of the locations. The exceptions tended to occur near schools and areas with significant congestion.
What Does This Mean for Practitioners?
The evidence above supports the hypothesis that larger traffic count data sets are needed to adequately estimate peak hour volumes for intersection and roadway analysis especially in congested areas and near unique land uses such as schools and major shopping centers. This raises the question of how to obtain that data cost effectively and within a reasonable schedule. To help answer that question, we are evaluating StreetLight’s turning movement volume estimates. The evaluation consists of statistical validation tests for how well StreetLight’s estimates match the observed intersection volumes from the large Roseville sample to support how the practice can evolve to use better data sources in the decision-making process.
Read Part Two of this series where we examine StreetLight as a potential source for larger samplings of turning movement volume estimates.
____
[1] https://www.fhwa.dot.gov/policyinformation/tmguide/tmg_fhwa_pl_17_003.pdf
[2] A Policy on Geometric Design of Highways and Streets¸ American Association of State Highway and Transportation Officials, 7th Edition, 2018 (AASHTO Green Book)
[3] A Policy on Geometric Design of Highways and Streets¸ American Association of State Highway and Transportation Officials, 7th Edition, 2018, Page 2-17.

