

Ridership+ enhances system-level perspectives of regional travel models with an often-overlooked focus on station-level planning and design strategies, to integrate transit into the community. It serves to increase transit ridership & active transportation, reduce traffic, and minimize local & regional environmental impacts. It works in conjunction with regional models by fine-tuning station ridership estimates to account for local factors like TOD development density and design, local walking and cycling connections, local transit service, and station parking supply. It also allows trade-off analysis among these factors, predicting the change in ridership and station access mode shares resulting from conversion of parking to TOD.
Ridership+ Allows Developers to...
Optimize your response to local policies on transit ridership and access, and to evaluate the cost/benefit of parking and access investments.
Ridership+ Allows Agencies to...
Perform trade-off and cost/benefit analysis of different station-area investment priorities such as changing feeder bus service, adding or removing parking, adding pedestrian connections and bike parking, or making land available for different forms of TOD.
Ridership+ Allows Local Jurisdictions to...
Evaluate transit ridership resulting from station-area development proposals.
Ridership+ Allows Land Use Planners to...
Assess the benefits of different densities and mixes of residential, retail, and office space in TOD planning.
Ridership+ Allows Economists to...
Perform trade-off analyses of the effects of using station-area land for parking or different combinations of land uses, and assess the benefits and impacts of investing in different station access improvements.
Competing Modes
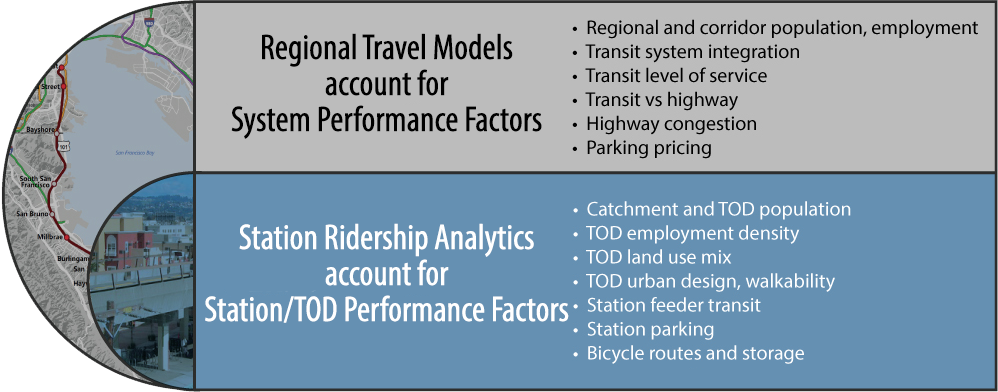
Successful transit depends on a combination of system-level and station-level factors; tools used to plan and evaluate transit concepts should consider the same factors. Factors that influence system performance include regional and corridor activity levels and door-to-door service levels offered by transit relative to competing modes. At the local level, station characteristics and local development context substantially influence usage and user experience.
Case Study 1
Caltrain Commuter Rail System Upgrade Study: Improved accounting for TOD and station access reduces inaccuracy in estimation of transit ridership and station parking, drop-offs, walking and biking.
%
Reduction in System Error with Ridership+
%
Increased Station Accuracy with Ridership+
%
Improved Station Estimates with Ridership+
Standard Travel Model Performance...
- System ridership estimate accuracy is within 1% of actual
- Most station estimates off by 15% or more
- Access mode estimates off by over 80%
Accounts for standard factors:
- Regional economics, demographics
- Transit system integration
- Highway congestion and pricing
- Regional parking policies
- Transit fares and service levels
*Santa Clara Valley Transportation Authority C/CAG Regional Travel Model
Improved Performance with Ridership+...
- Reduces system error to about 1/4%
- Improves estimates at 18 of 23 stations
- Reduces station inaccuracy 25%
- Accurately backcasts
- Improves access mode estimates
Accounts for all standard factors, plus:
- TOD population and jobs
- TOD walkability
- Local bikeway density
- Feeder shuttle service
- Station parking supply
- Station parking costs
Case Study 2
Bay Area Rapid Transit (BART) Metro Vision Study: Improved accounting for TOD, station access and parking supply constraints increases accuracy of ridership estimation at 80% of stations.
%
Increased Accuracy with Ridership+
%
Improved Station Estimates with Ridership+
Standard Travel Model Performance...
- System ridership estimate accurate within about 4% of actual
- Most station estimates off by 35% or more
- Access mode estimates don’t account for TOD, station parking capacity
Accounts for standard factors:
- Regional economics, demographics
- Transit system integration
- Highway congestion and pricing
- Regional parking policies
- Transit fares and service levels
*SF Bay Area Metropolitan Transportation Commision (MTC) Regional Travel Model
Improved Performance with Ridership+...
- Preserves system estimates
- Accounts for parking capacity constraint
- Improves estimates at 80% of stations
- Reduces station inaccuracy 55%
- Accurately backcasts
Accounts for all standard factors, plus:
- TOD population and jobs
- TOD walkability
- Relationship between station parking supply and demand
- Feeder shuttle service
Learn more by contacting one of our industry experts.