
How will autonomous vehicles influence the future of travel?
Agencies dedicate a great deal of time and effort developing and using models to forecast future travel behavior. A key challenge is that current models often do not account for modes or travel choices that don’t yet exist. This makes predicting the effects of autonomous vehicles (AVs) or mobility as a service (MAAS) uncertain, and raises questions about how to best predict their influence. At a minimum, our existing models need to evolve. So our FP Think Initiative tested how current practice regional models in the U.S. responded to commonly accepted AV input effects such as lowering parking costs and increasing freeway capacity. The results are shown for scenarios where AVs are privately owned and where half of trips are made as shared rides similar to potential MAAS offerings. The models confirm that making vehicle travel more convenient has the potential to significantly increase vehicle use and reduce transit ridership.
See our latest AV modeling research presented at the TRB Annual Meeting. Click here for the associated technical paper.
How did we approximate an AV future?
Each model is structured a bit differently, so our approach varied somewhat in each case. The following lists the most common variables used:
- Terminal Time – Travel models define the time needed to park your car and walk to a destination as “terminal time.” The higher a terminal time, the less likely a person will choose an auto for a particular trip. AVs are likely to reduce terminal times by eliminating the need to park. The amount of reduction though will depend on the curb space management policies in cities and how they prioritize curb space use.
- Parking Cost – Most models include a variable for parking cost in areas where costs are imposed. AVs have the potential to lower or even eliminate these traditional parking costs. However, cities in the future may impose pick-up and drop-off costs for AV use depending on location to help manage peak period traffic demands.
- Value of Time – Travel models also incorporate the value of time, but in different ways. We expect travelers using AVs will have lower values of time because the opportunity cost of driving will be reduced.
- Auto Availability – Models generally have variables tied to trip rates and auto availability. AVs may increase trip rates due to their greater convenience and ready availability. Greater convenience could lead to more discretionary vehicle trips for shopping, social, leisure or recreational purposes. Additionally, people not licensed to drive will be able to make vehicle trips. Vehicle availability will increase for many households and at workplace locations – especially those in urban areas.
- Roadway Capacity – As vehicles become more automated and connected, they offer greater potential to increase roadway capacity especially on freeways. The increase in capacity will come from shorter headways, less weaving, and more stable traffic flows. We expect that freeway capacity will increase first on freeways and expressways, then on major arterials.
Average of Results
We feel we have enough data points across enough geographies to draw conclusions from the averages.
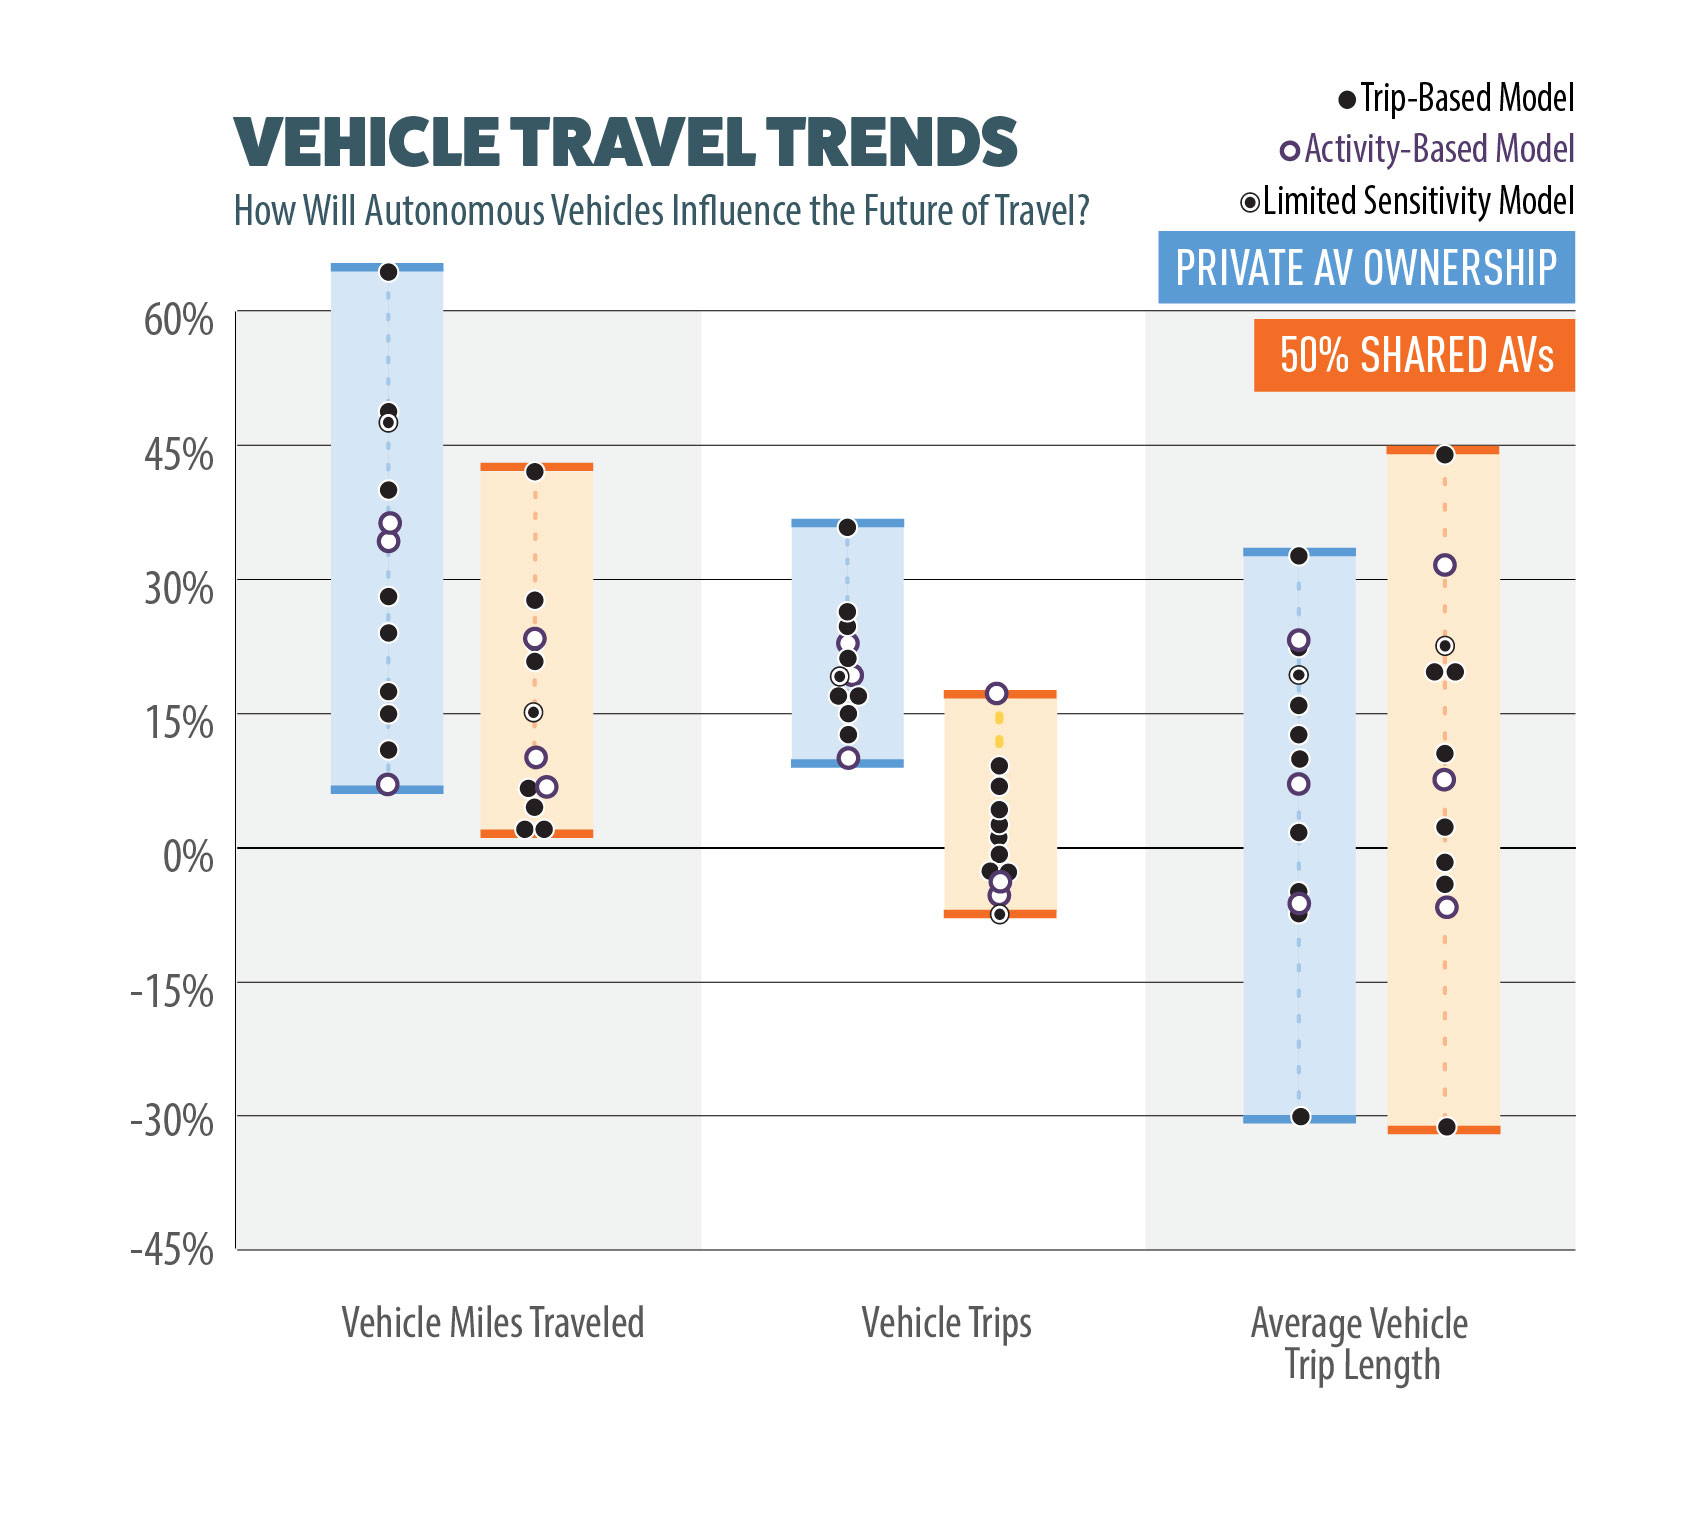
- Vehicle trips increase by an average of 20% without any shared use regulation. That increase is virtually eliminated (on average) with 50% of the AVs required to be shared rides.
- VMT increases by an average of 31% without any shared-use regulation. That increase is halved (on average) with 50% of the AVs required to be shared rides.
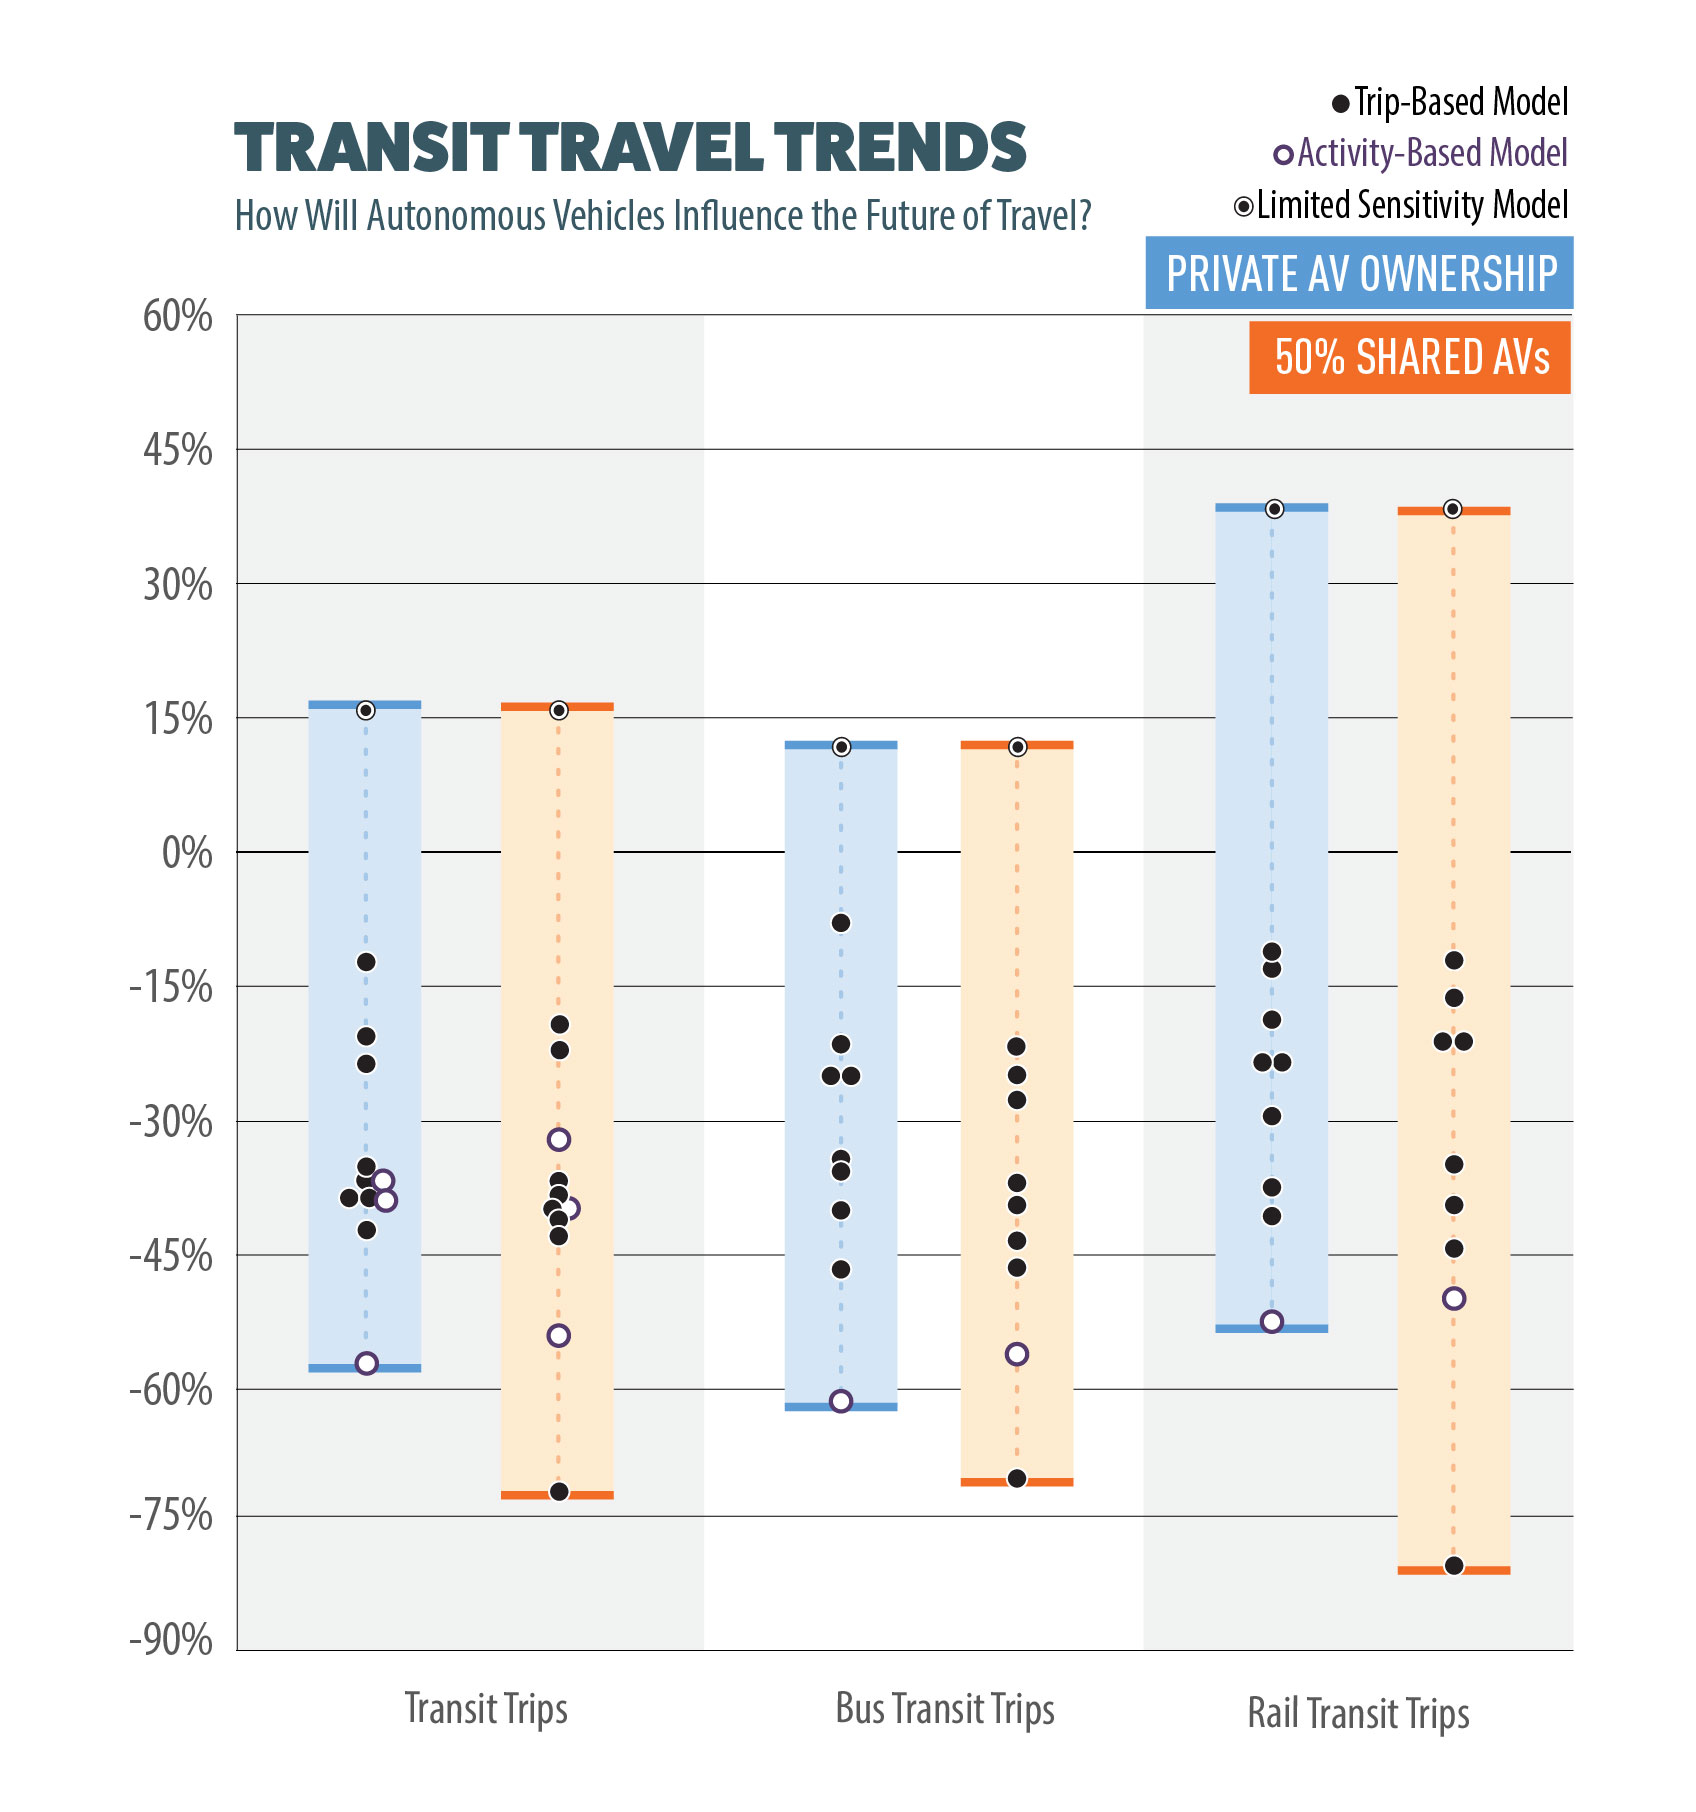
- Transit trips decline by an average of 29% without any shared use regulation, which grows to 35% with 50% of the AVs required to be shared rides.
- On average, bus and transit trips less than 5 miles decrease more than rail and transit trips greater than 5 miles.
Auto Metrics
| Performance Metrics | No Regulation for Ridesharing | 50% of AV Trips are Shared |
| Vehicle Trips | 20% | 2% |
| Drive Alone Trips | 21% | -35% |
| HOV Trips | 24% | 138% |
| Vehicle Miles Traveled | 31% | 14% |
| Average Vehicle Trip Length | 7% | 10% |
| Vehicle Hours of Delay | 52% | 6% |
| Average Vehicle Occupancy | 0% | 27% |
Transit Metrics
| Performance Metrics | No Regulation for Ridesharing | 50% of AV Trips are Shared |
| Transit Trips | -29% | -35% |
| Bus Transit Trips | -28% | -34% |
| Rail Transit Trips | -23% | -28% |
| Long Distance Transit Trips (5+ miles) | -27% | -28% |
| Short Distance Transit Trips (<5 miles) | -31% | -38% |
Range of Results
The following highlight the key findings of our results of the nine models we’ve tested thus far. Please note that all results presented are comparisons to the future condition without any AVs.
- Vehicle Miles Traveled (VMT) increased in all nine models (range of +8% to +68%) when assuming no regulatory requirement for ridesharing.
- If 50% of AV trips are shared, it would help mitigate the VMT increase but not fully offset it (range of +1% to +43%).
- The regulated ridesharing scenario would also substantially reduce vehicle delay, but would increase the average trip length.
- Total transit trips declined in eight of the nine models tested by a range of -12% to -43%. The other model showed increased transit trips of 16%.
Standard Deviation of Results
Auto Metrics
| Performance Metrics | No Regulation for Ridesharing | 50% of AV Trips are Shared |
| Vehicle Trips | 4% | 4% |
| Drive Alone Trips | 4% | 5% |
| HOV Trips | 4% | 54% |
| Vehicle Miles Traveled | 12% | 9% |
| Average Vehicle Trip Length | 11% | 11% |
| Vehicle Hours of Delay | 35% | 3% |
| Average Vehicle Occupancy | 1% | 8% |
Transit Metrics
| Performance Metrics | No Regulation for Ridesharing | 50% of AV Trips are Shared |
| Transit Trips | 10% | 8% |
| Bus Transit Trips | 9% | 8% |
| Rail Transit Trips | 9% | 11% |
| Long Distance Transit Trips (5+ miles) | 15% | 16% |
| Short Distance Transit Trips (<5 miles) | 14% | 13% |
Does the Type of Model Matter?
In U.S. travel forecasting, it’s rare to have more than one regional model available to test future scenarios. As a result, practitioners often face the dilemma about how much confidence to associate with a single value forecast. A range of forecast values is usually desirable as it can help capture the potential uncertainty associated with an outcome 20+ years into the future. For our AV tests, we had the opportunity for one region to test a traditional trip-based model and an activity-based model (ABM). The original AV test results included the trip-based model output. Our charts above have been updated to include the new ABM result, which is shown in a different color than the rest of the tests. Results from two more ABMs will be added later this summer.
What’s next for travel demand models?
Current modeling platforms are capable of roughly estimating the effects of AVs on travel demand and behavior, as long as automated travel can be approximated via a small number of scenarios. However, it is noteworthy that the range of predicted outcomes for the same scenario varies appreciably between certain models. While it is certainly possible that the future effects of AVs could vary by geographic region, we feel it would be much more useful to directly model these variables in a context-specific manner rather than approximating them. Future travel forecasting models will need to evolve so they can more directly capture AV-related variables to more reliably predict future outcomes associated with automated technology.
Learn more by contacting one of our industry experts.
Quick Links
© 2017 – 2024 Fehr & Peers. All rights reserved.